Scan rate benchmarking for QR codes: 2026 guide
TL;DR:
- Scan rate benchmarking measures the proportion of QR code scans relative to exposed impressions and compares it against industry standards. Variations in placement type, measurement window, and tracking methodology significantly influence the reported scan rate. Using consistent definitions, fixed windows, and reliable tools like server-side tracking ensures accurate, actionable campaign insights.
Scan rate benchmarking is the practice of measuring the proportion of QR code scans against estimated exposed impressions, then comparing that figure against industry reference ranges to judge whether a campaign is performing below, at, or above expectations. As eMarketer defines it, scan rate is a recognised KPI across placements from connected TV to retail packaging. It belongs on every marketer’s dashboard, but it should sit alongside conversion-per-scan and landing completion rate rather than standing alone as the sole success metric.
To give you a quick sense of the range you are working within:
- Passive placements (posters, packaging left on shelves): scan rates typically sit at a low percentage of estimated impressions
- Active or high-intent placements (event badges, point-of-sale prompts, CTV overlays with a clear call to action): rates climb noticeably higher, often reaching a moderate percentage range
- Incentivised or highly contextual placements (loyalty rewards, exclusive content unlocks): the strongest campaigns can exceed these mid-range figures by a noticeable margin
One important note on terminology: as Barcode Test LLC explains, “scan rate” carries multiple technical meanings depending on context. Scanner manufacturers may use it to mean attempts per second; quality-verification contexts may mean successful captures per second. Throughout this guide, “scan rate” means campaign scan rate: the share of exposed impressions that resulted in a recorded scan. Where print symbol quality is relevant, ISO and GS1 specifications are the appropriate anchors.
Table of Contents
- What does scan rate benchmarking actually measure?
- How do scan rates compare across industries in 2026?
- What drives scan rate most, and where should you test first?
- Measurement limits and common pitfalls to avoid
- Which tools give you reliable scan rate data?
- Key takeaways
- The benchmark number is not the whole story
- Qrlytics gives you the data to benchmark with confidence
- Useful sources
- FAQ
What does scan rate benchmarking actually measure?
The formula is straightforward:
Scan Rate (%) = (Scans ÷ Estimated Exposed Impressions) × 100
You can apply it with either unique scans or total scans as the numerator, but you must be consistent and declare which you used.
Measurement window: why it matters more than you might expect
The window you choose changes the number you report. A 7-day window captures the initial burst of activity but misses late adopters. A 28-day window is the most common standard for print campaigns. A full campaign-life window is the most complete but makes cross-campaign comparison harder unless cohort dates are disclosed.
This is analogous to a principle well understood in instrumentation: measurement window and sampling rate directly affect the signal you observe. Choose a window that fits your campaign type, then keep it fixed across all cohorts you intend to compare.
Worked example
Suppose a retail packaging campaign prints a large number of units. Over a 28-day window, the platform records several hundred to over a thousand total scans and several hundred unique scans.
| Metric | Value |
|---|---|
| Estimated impressions | Print run volume |
| Total scans (28 days) | Hundreds to over a thousand |
| Unique scans (28 days) | Several hundred |
| Total scan rate | Low single-digit percentage range |
| Unique scan rate | Lower single-digit percentage range |
| Repeat-scan rate | A fraction indicating some return visits |
The margin of error here is meaningful: if actual consumer reach was 35,000 rather than 50,000 (because some units remained in the warehouse), the unique scan rate rises to 2.6%. Always state your denominator assumption.
Pro Tip: Use unique scan rate as your headline benchmark figure and report total scans separately as an engagement indicator. Mixing the two across campaigns is the single most common cause of misleading comparisons.
For a deeper look at QR code tracking methodology, including how to tag codes for cohort separation, the Qrlytics blog covers the practical setup in detail.
How do scan rates compare across industries in 2026?
Continued growth in QR code adoption across retail, hospitality, and media means benchmark ranges are shifting upward as consumer familiarity increases. That said, placement context still explains more variance than industry alone.
| Industry / Use case | Placement type | Typical scan rate range | Key driver |
|---|---|---|---|
| Events (badges, tickets) | Active, high-intent | Higher end of range | Immediate utility, clear CTA |
| Retail packaging | Passive | Low to mid range | Shelf visibility, no active prompt |
| Print advertising | Passive | Low range | Short exposure window, no incentive |
| Hospitality (menus, tables) | Active, contextual | Mid to higher range | Captive audience, clear value |
| Healthcare (leaflets, posters) | Passive to active | Low to mid range | Trust barrier, varied literacy |
| CTV overlays | Active, time-limited | Variable, tracked as KPI | Screen-to-phone friction |
A few points worth noting on this table:
- Zero-scan share matters. In any large print campaign, a meaningful proportion of individual code placements will record zero scans. Reporting the median scan rate across placements (rather than the mean) gives a more honest picture of typical performance, because a handful of high-performing placements can inflate the mean.
- Time-to-first-scan concentration: for active placements such as event badges, the majority of scans tend to arrive within the first day or two. For packaging, scans spread across weeks. This affects how quickly you can make optimisation decisions.
- CTV is worth singling out: eMarketer tracks CTV QR code scan rate as a dedicated industry KPI, reflecting how seriously broadcasters and advertisers now treat the metric. The screen-to-phone transition introduces friction that suppresses rates relative to in-hand placements, so CTV benchmarks should never be compared directly against retail or event figures.
For context on which industries are leading QR adoption in 2026, usage patterns vary considerably by sector, and that variation feeds directly into what a “normal” scan rate looks like for your campaign type.
What drives scan rate most, and where should you test first?
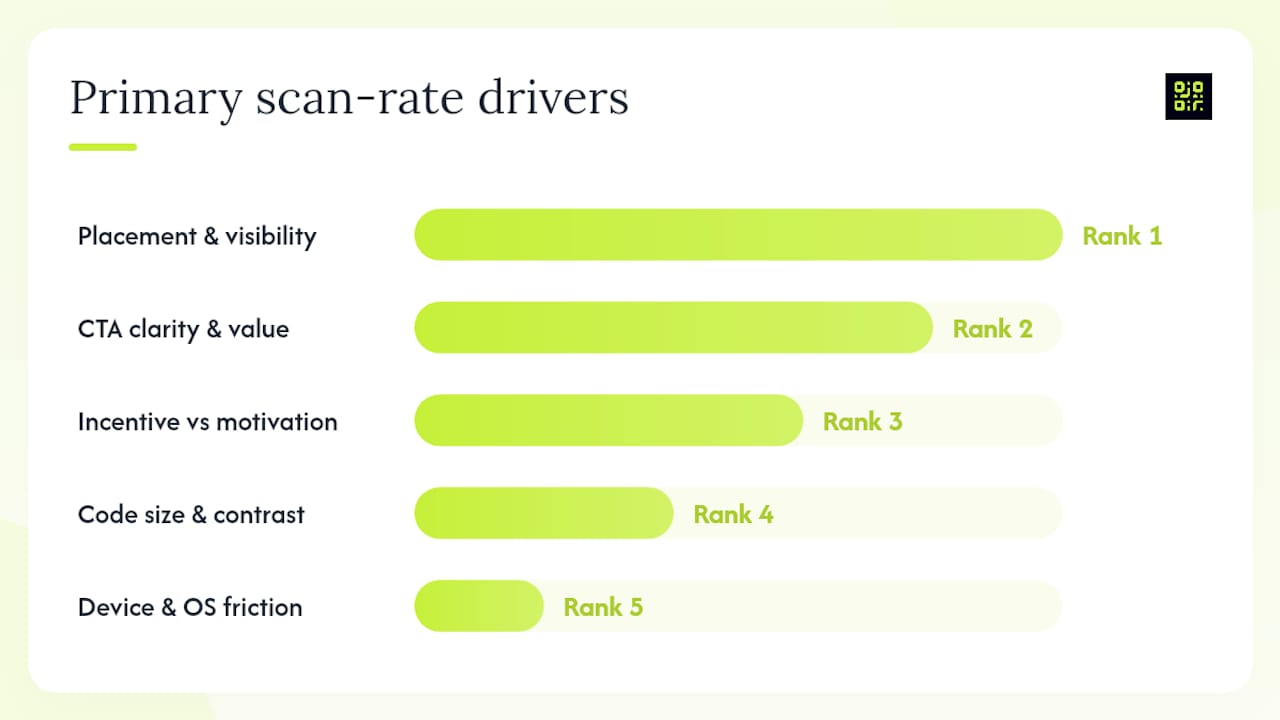
Ranked by the size of the effect you can realistically move through campaign decisions:
- Placement and visibility. A code that requires the audience to stop, crouch, or change orientation will underperform regardless of creative quality. Position at eye level, in the natural path of attention.
- CTA clarity and value proposition. “Scan to see the menu” outperforms a bare QR code with no label. The value must be obvious before the scan, not after.
- Incentive vs organic motivation. Offering a discount, exclusive content, or entry to a competition lifts scan rates, particularly on passive placements where there is no inherent reason to engage.
- Code size and contrast. Codes smaller than 2.5 cm at typical reading distance, or printed on low-contrast backgrounds, fail at the device level before any campaign variable matters.
- Device and OS friction. Native camera scanning (available on iOS since 2017 and Android since 2018) has largely removed the app-download barrier, but older devices and some Android skins still require a dedicated app. Understanding current scanning behaviour by device helps you set realistic expectations for your audience.
- Audience intent and context. A captive audience waiting in a queue or seated at a restaurant table has time and motivation. A commuter passing a poster does not.
- Timing and context. A code on a product that is purchased and taken home may be scanned days after purchase. A code on an event screen may have a 30-second window.
Pro Tip: When running an A/B test on CTA text, change only the label printed beneath the code, keep the destination URL identical, and run both variants for the same duration on matched placements. This isolates the CTA variable cleanly. Use dynamic codes so you can update the destination without reprinting if the test reveals a better landing experience.
When recording a driver test, capture: placement location, code size in millimetres, CTA text, incentive type (if any), estimated impressions method, measurement window, and SDK or platform used for tracking. Without these, you cannot reproduce or compare results.
- QR code consistency across placements also affects aggregate scan rates; inconsistent sizing or contrast between print runs introduces noise into your data.
- Common implementation mistakes such as placing codes in low-light areas or using overly complex URL destinations can suppress scan rates independently of creative quality.
For incentivised placements, particularly in hospitality and small business contexts, QR-based tip collection is one example of a high-motivation use case where scan rates tend to be strong because the value exchange is immediate and clear.
Worked example table
| Variable | Value | Assumption |
|---|---|---|
| Campaign type | Retail POS display | Single store, multi-week run |
| Estimated impressions | Thousands | Estimated from footfall or platform data |
| Unique scans (28 days) | Hundreds | Platform-deduplicated |
| Total scans (28 days) | Several hundred | All recorded events |
| Unique scan rate | Around a low single-digit percentage | Based on denominator choice |
| Total scan rate | Slightly higher than unique rate | Same denominator |
| Sensitivity | Varies with exposure uncertainty | Reflects estimation range |
Pro Tip: Always run the sensitivity check in step 6 before presenting results to stakeholders. A scan rate that looks strong at 3.0% but collapses to 2.5% under a modest exposure adjustment tells a very different story from one that holds firm across the range. Real-time analytics let you catch anomalies early and recheck your exposure assumptions mid-campaign.
High-quality benchmarking reports always disclose sample size, cohort dates, how unique scans were counted, and how exposure was estimated. The Dynamsoft SDK benchmark is a useful methodological reference: it tested across 83 real-world images, reported both total and unique detection counts, and named the exact dataset, making its results reproducible. Apply the same discipline to campaign benchmarks.
KPIs to monitor beyond scan rate
- Landing page completion rate: the share of scanners who complete the intended action (form, purchase, video view). Completion rate is often more meaningful than scan rate for conversion-focused campaigns.
For A/B tests to produce reliable signal, run each variant for at least the same duration and on matched placements. As a rough guide, aim for at least 200 unique scans per variant before drawing conclusions; smaller samples produce noisy results that can mislead optimisation decisions.
Measurement limits and common pitfalls to avoid
Scan rate analysis is only as reliable as the inputs. These are the most common ways benchmarks go wrong.
- Exposure uncertainty. Print-run volume is not the same as consumer reach. Units in a warehouse, codes obscured by stickers, or placements removed early all reduce actual exposure without reducing your denominator.
- Selection bias. Campaigns that get benchmarked tend to be the ones that performed well enough to report. Published industry benchmarks may therefore skew high.
- Cross-channel double counting. If the same code appears in a print ad and a social post, scans from both channels hit the same counter. Separate cohorts by channel using distinct codes or UTM-tagged redirect URLs.
- Short windows that miss late scans. A 7-day window on a packaging campaign may capture only a fraction of eventual scans. Declare the window and acknowledge what it excludes.
- Small-sample noise. A campaign with 50 total scans cannot produce a reliable scan rate. The confidence interval around a 3% rate on 50 impressions is enormous. Academic work on extrapolation from narrow measurement ranges illustrates how conclusions drawn from insufficient data can be systematically wrong, and the same caution applies to campaign benchmarks built on thin samples.
Pro Tip: When scan rate is the wrong KPI, say so. For a healthcare leaflet where the goal is appointment bookings, conversion per scan matters far more than the raw scan rate. Presenting a low scan rate without context can cause stakeholders to abandon a campaign that is actually delivering strong downstream results.
On UK data protection: under UK GDPR, scan analytics that record device identifiers or location data constitute personal data processing. Use a platform with consent-friendly tracking and document your lawful basis. This is general guidance; confirm your specific obligations with a qualified data protection adviser.
Which tools give you reliable scan rate data?
The platform and toolchain you use directly affect the numbers you measure. This is not a minor implementation detail: SDK and decoding algorithm differences produce materially different detection counts on identical image sets, which means two campaigns using different scanning libraries are not directly comparable without methodology disclosure.
Client-side vs server-side tracking
Client-side scanning libraries such as html5-qrcode and jsQR are practical for web-based or event-specific scanning experiences, but their frame rate, decoding strategy, and default settings all affect which codes are detected and how many events are logged. Two implementations of the same library can produce different counts on the same physical code. Server-side redirect tracking, by contrast, logs every scan at the network level, independent of the client’s decoding behaviour, giving you a consistent and reproducible event stream.
Qrlytics uses server-side redirect tracking as its measurement foundation, which means scan events are captured consistently regardless of which device or app the end-user scans with. The platform provides unique-scan deduplication, timestamped events, device and location metadata, global heatmaps, CSV export, and API access, giving you the full feature set needed to run reproducible benchmarks and sensitivity checks. GDPR-compliant tracking is built in, which matters for UK campaigns where personal data obligations apply.
Key takeaways
Scan rate benchmarking is only reliable when you fix the denominator method, declare the measurement window, and choose unique or total scans consistently before comparing results across campaigns or industries.
| Point | Details |
|---|---|
| Define cohort and window first | Fix your measurement window and cohort scope before a campaign launches to keep comparisons valid. |
| Disclose your denominator | State whether impressions come from print-run volume, platform data, or footfall, and note the confidence level. |
| Prioritise placement and CTA | Moving from passive to active placement and adding a clear value-led CTA are the highest-leverage changes available. |
| Report unique and total scans separately | Use unique scan rate as your headline benchmark and total scans as an engagement indicator, never mixed. |
| Qrlytics supports reproducible benchmarks | Qrlytics provides unique-scan deduplication, timestamped events, CSV export, and GDPR-compliant tracking for defensible campaign measurement. |
The benchmark number is not the whole story
There is a tendency in QR campaign reporting to treat scan rate as a pass/fail grade. A campaign hits 2% and someone declares it underperformed; another hits 5% and gets celebrated. Neither conclusion is defensible without knowing the placement type, the denominator method, the measurement window, and what happened after the scan.
The more useful question is not “what was our scan rate?” but “what does our scan rate tell us about where the audience dropped off?” A 4% scan rate on a passive poster placement with a strong CTA is genuinely impressive. The same rate on an event badge handed to every attendee suggests something went wrong with the landing experience, because the intent was already there.
Benchmarking scan rates becomes genuinely useful when you treat it as a diagnostic rather than a verdict. Compare your rate against the right reference class (same placement type, similar audience, comparable window), run the sensitivity check on your exposure estimate, and then look downstream at completion rate and conversion per scan before drawing any conclusions about campaign quality.
One practical tip worth applying immediately: when presenting benchmark results to stakeholders, lead with the denominator assumption and the measurement window before stating the rate itself. Stakeholders who understand the inputs are far less likely to draw the wrong conclusions from the number, and far more likely to support the kind of controlled experiments that actually improve performance over time.
Qrlytics gives you the data to benchmark with confidence
Scan rate analysis is only as good as the data behind it. Qrlytics is built for marketers and analysts who need clean, reproducible scan data rather than approximate counts from free tools that expire or lose history.
With Qrlytics, you get real-time scan analytics with unique-scan deduplication, so your headline benchmark figure reflects actual reach rather than inflated repeat visits. Exportable cohort reports let you run sensitivity checks and compare campaigns across windows without manual data wrangling. And because Qrlytics uses server-side redirect tracking, every scan event is captured consistently regardless of the end-user’s device or scanning app.
GDPR-compliant tracking is included as standard, which matters for any UK campaign where device-level data is collected. Codes created during an active subscription remain functional permanently, so your benchmark data stays intact even as campaigns evolve.
Create your first trackable QR code with no credit card required, or explore the full analytics and tracking features to see how Qrlytics supports repeatable, defensible benchmarking from day one.
Useful sources
Before applying any published benchmark number to your own campaigns, check the methodology: what was the denominator, how were unique scans counted, and what was the measurement window? Numbers without those disclosures are not comparable.
| Source | Why it is useful |
|---|---|
| eMarketer CTV QR Code Scan Rate KPI | Tracks CTV scan rate as a live industry KPI; useful for understanding how the metric is defined and reported at scale. |
| Dynamsoft SDK Benchmark | Tests four barcode SDKs on 83 real-world images; exemplary methodology disclosure including total and unique detection counts. |
| Barcode Test LLC on scan rate terminology | Clarifies the multiple meanings of “scan rate” and recommends ISO/GS1 anchors for print symbol quality contexts. |
| Mordor Intelligence QR Code Market Report | Market size and adoption data providing context for industry-level scan behaviour variation. |
| html5-qrcode (GitHub) | Documentation for a widely used client-side JS scanning library; useful for understanding implementation variables that affect scan counts. |
| jsQR (GitHub) | Alternative client-side JS decoder; useful for comparing library-level detection differences. |
| Rodeostat cyclic voltammetry tutorial | Illustrates how measurement window and sampling rate affect observed signal; a useful analogy for campaign window selection. |
| Corrected Gileadi method (ScienceDirect) | Academic example of extrapolation errors from narrow measurement ranges; relevant to sensitivity checks and exposure estimation. |
- CTV QR Code Scan Rate Overall (Benchmarks & KPIs)
- Which Barcode Scanner SDK Is Most Accurate? Dynamsoft vs Scandit vs Scanbot vs Strich — 83 Real-World Images | Dynamsoft Blog
- Scan Rate as a Basis for Barcode Verification - Barcode Test LLC
- mordorintelligence.com
- github.com
- github.com
- Tutorial: cyclic voltammetry and scan rate (Rodeostat blog)
- A corrected Gileadi method for accurate determination of standard rate constants from cyclic voltammetry - ScienceDirect
FAQ
What is scan rate benchmarking for QR codes?
Scan rate benchmarking is the process of calculating the proportion of QR code scans against estimated exposed impressions, then comparing that figure against industry reference ranges to assess campaign performance. It helps marketers judge whether a scan rate is weak, typical, or strong for a given placement type and context.
How do you improve scan rate on a QR campaign?
Moving from a passive to an active placement, adding a clear CTA with a stated benefit, and increasing code size and contrast are the three highest-impact changes. For ongoing optimisation, use dynamic codes so you can update the landing destination without reprinting, and monitor completion rate alongside scan rate.
What is a typical scan rate in retail?
Retail packaging and shelf placements are passive contexts, so scan rates tend to sit in the low single digits as a percentage of estimated impressions. Point-of-sale displays with a clear prompt and incentive perform noticeably better. Always compare against the same placement type rather than a cross-industry average.
What is a benchmark, with an example?
A benchmark is a reference value that lets you judge whether your result is below, at, or above typical performance. For QR codes, an example benchmark might be the median unique scan rate for retail POS placements over a 28-day window, against which you compare your own campaign’s unique scan rate calculated on the same basis.
Does the scanning SDK affect measured scan rates?
Yes. Different barcode scanning SDKs produce materially different detection counts on identical image sets due to differences in decoding algorithms and default settings. Server-side redirect tracking, as used by Qrlytics, avoids this variability by logging scan events at the network level rather than relying on client-side decoding.