Why QR code completion rate matters for marketers

TL;DR:
- QR code completion rate measures how many users take valuable actions after scanning, providing a more meaningful metric than scan volume. Improving this rate depends on landing page quality, offer alignment, placement, and technical reliability, with dynamic codes enabling better tracking. Focusing on completion rate helps marketers optimize campaigns and drive measurable revenue instead of just counting scans.
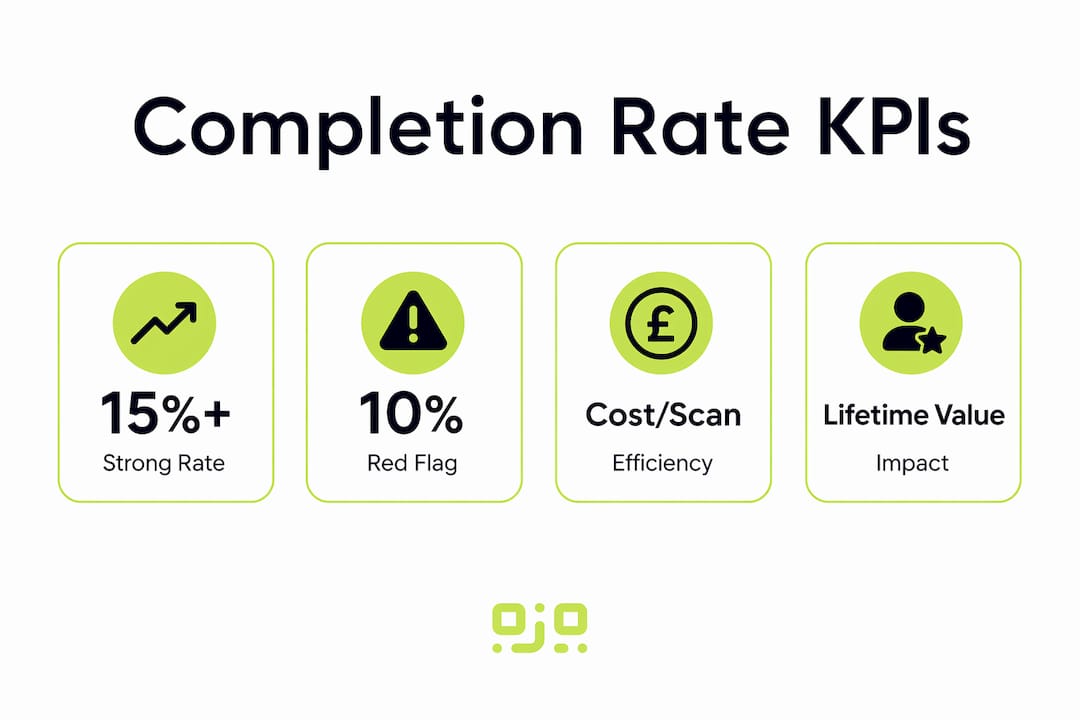
QR code completion rate is defined as the percentage of users who scan a QR code and then complete a desired action, such as making a purchase, submitting a form, or signing up for a newsletter. Scan volume tells you how many people noticed your code. Completion rate tells you how many people actually did something valuable. Typical scan-to-completion rates range between 5% and 25%, with 15% considered strong performance for consumer-facing campaigns. That benchmark is your first reference point for judging whether a campaign is working or wasting budget.
Most marketers still report scan counts in their campaign dashboards. That is the wrong metric to lead with. A QR code printed on 10,000 restaurant menus might generate 3,000 scans and still deliver zero revenue if the landing page is broken or the offer is irrelevant. Understanding why QR code completion rate matters is the difference between running campaigns that feel busy and running campaigns that generate measurable returns.

What does completion rate reveal about campaign effectiveness?
Completion rate is a direct indicator of landing page quality, offer relevance, and the overall user experience after the scan. A high scan count with a low completion rate signals a specific problem: something breaks down between the moment a user scans and the moment they act. That breakdown costs you money.
Scan counts are a vanity metric. They measure curiosity, not intent. Completion rate measures intent converted into action, which is the only thing that generates revenue. A campaign with 4,200 scans and a 20% completion rate delivers 840 completed orders and attributed revenue. The same campaign with a 5% completion rate delivers 210 orders. The difference is not the QR code itself. It is everything that happens after the scan.
Completion rate also exposes friction in the customer journey that scan data hides entirely:
- A landing page that loads slowly on mobile will cause users to abandon before the page even renders.
- A form with eight required fields will lose most users after the second field.
- An offer that does not match what the QR code promised creates immediate distrust and exit.
- A broken redirect sends users to a 404 page, and those scans vanish from your conversion data with no explanation.
The four metrics most critical to QR code ROI are cost per scan, completion rate, customer lifetime value, and payback period. Completion rate sits at the centre of that framework because it connects your spend directly to your outcome. Without it, the other three metrics are incomplete.
Pro Tip: If your completion rate drops below 10%, treat it as a red flag requiring immediate investigation. Check your landing page load speed, your redirect URL, and whether your offer matches what the QR code communicates.
What factors affect QR code completion rates?
Low completion rates rarely have a single cause. They are usually the result of several compounding issues across the scan journey. Identifying which factor is responsible requires looking at each stage separately.
-
Landing page performance. Slow load times, mobile-unfriendly design, and excessive form length are the most common causes of low completion. Most QR code scans happen on mobile devices. A page that takes more than three seconds to load on a mobile connection will lose a significant portion of users before they see your offer.
-
Offer and message alignment. Mismatch between the QR code’s promise and the landing page experience reduces completion sharply. If your QR code says “Get 20% off” and the landing page opens to a generic homepage, users feel misled and leave. The landing page must deliver exactly what the code promised.
-
Placement and user intent. QR codes on restaurant table tents achieve 15–30% scan rates, while billboard placements see as low as 0.5–3%. Placement determines the quality of the user’s intent at the moment of scanning. A user scanning a table tent is seated, engaged, and has time. A user passing a billboard does not. Higher intent at the point of scan generally produces higher completion rates downstream.
-
Static versus dynamic codes. Static QR codes provide no scan data. Dynamic codes route scans through a tracking server, capturing timestamps, device types, and geographic location. Without that data, you cannot identify where users drop off or which placements perform best. You are optimising blind.
-
Technical reliability. A code that redirects inconsistently, or one tied to a subscription that has lapsed, produces failed scans that register as zero completions. This is a structural problem that no amount of landing page testing will fix.
Pro Tip: Use a QR code tracking guide to audit each stage of your scan journey separately. Isolate the drop-off point before making changes, or you risk fixing the wrong thing.
How to improve QR code completion rates
Improving completion rates requires changes at every stage of the scan journey, not just the QR code itself. The strategies below address the most common failure points.
-
Simplify your landing page. Remove every element that does not directly support the conversion action. One clear headline, one offer, one call to action. Reducing form fields from eight to three can double completion rates on promotional campaigns. For practical examples, see landing pages that convert for QR code campaigns.
-
Use dynamic QR codes. Dynamic codes let you update the destination URL without reprinting the code. They also capture the scan data you need to measure completion accurately. Qrlytics generates dynamic codes with real-time analytics built in, so you can see exactly where users drop off and adjust without delay.
-
Match your landing page to your code’s promise. The first sentence on your landing page should mirror the message on the QR code’s call to action. If the code says “Claim your free trial,” the page headline should confirm that offer immediately.
-
Test placement systematically. Run the same QR code across two or three placements and compare completion rates, not just scan volumes. A code on a product package will behave differently from the same code on a flyer. Placement data tells you where your audience is most ready to act. For more on this, ways to boost scans covers placement strategy in detail.
-
Communicate the benefit before the scan. The text around your QR code should answer one question: “What do I get if I scan this?” Users who understand the benefit before scanning arrive at the landing page with higher intent and complete at higher rates.
-
Set realistic targets. A conversion rate above 10% is considered good for most QR code campaigns. Targeting 15% or above puts you in strong performance territory. Use these benchmarks to set campaign goals before launch, not after.
How to measure QR code completion rates within broader analytics
Completion rate becomes most useful when you combine it with other metrics rather than reading it in isolation. Scan volume, engagement time, downstream conversions, and customer lifetime value each add context that changes how you interpret a completion rate figure.
UTM parameters and e-commerce tracking allow you to attribute revenue directly to individual QR code campaigns. Tag your destination URLs with campaign source, medium, and content parameters. Connect those tags to your analytics platform. You can then see not just how many users completed the desired action, but how much revenue each campaign generated and at what cost per conversion.
Comparing QR code completion rates with other marketing channels helps you allocate budget more effectively. If your QR code campaigns consistently outperform your email click-to-conversion rate, that is a signal to invest more in physical QR placements. If they underperform, the completion rate data tells you exactly where to focus improvement efforts. For a deeper look at how real-time QR data fits into broader campaign analytics, the principles apply directly here.
Brands that focus solely on scan counts without designing for repeat behaviour risk losing long-term engagement and customer lifetime value. Completion rate is the entry point, but repeat completion rate, meaning users who return and convert again, is the metric that reveals whether your QR code campaigns build lasting customer relationships. Tracking completion trends over time also shows whether campaign optimisations are working or whether performance is declining due to audience fatigue or offer staleness.
Pairing completion rate data with conversion rate optimisation principles gives you a structured framework for iterating campaigns. The same logic that improves a paid search landing page applies directly to a QR code destination page.
Key takeaways
QR code completion rate is the single most important metric for evaluating whether a QR code campaign generates real value, because it measures action rather than attention.
| Point | Details |
|---|---|
| Completion rate beats scan volume | Scan counts measure curiosity; completion rate measures whether users took the action you needed. |
| Benchmark for strong performance | A completion rate above 15% is strong for consumer campaigns; above 10% is considered good. |
| Landing page quality drives results | Slow load times, long forms, and offer mismatch are the leading causes of low completion. |
| Dynamic codes are non-negotiable | Static codes provide no tracking data, making it impossible to measure or improve completion rates. |
| Combine metrics for full picture | Pair completion rate with UTM tracking, customer lifetime value, and payback period for accurate ROI. |
The metric most marketers are still ignoring
After years of working with QR code campaigns across retail, hospitality, and events, the pattern is consistent: marketers celebrate scan milestones and ignore completion data. A campaign that generates 10,000 scans feels like a success. A campaign that generates 10,000 scans and 400 completions is a failure with a good story attached to it.
The mindset shift required here is not complicated, but it is uncomfortable. Completion rate forces you to confront the quality of your landing page, the clarity of your offer, and the alignment between what you promised and what you delivered. Scan counts let you avoid that conversation. That is precisely why so many teams default to reporting them.
The most common mistake I see is treating QR codes as a distribution mechanism rather than a conversion channel. A QR code is not just a way to get someone to a URL. It is the opening of a transaction. Every element after the scan, the page, the offer, the form, the confirmation, is part of that transaction. Completion rate measures whether the transaction succeeded.
If you are new to tracking completion rates, start with one campaign and one placement. Set a baseline. Make one change to the landing page. Measure again. The data will tell you more in two weeks than a year of scan count reports ever could.
— The
Qrlytics gives you the data to act on completion rates
Knowing that completion rate matters is only useful if you can actually measure it. Qrlytics provides the analytics infrastructure to track every scan, monitor drop-off points, and update destination URLs without reprinting a single code.
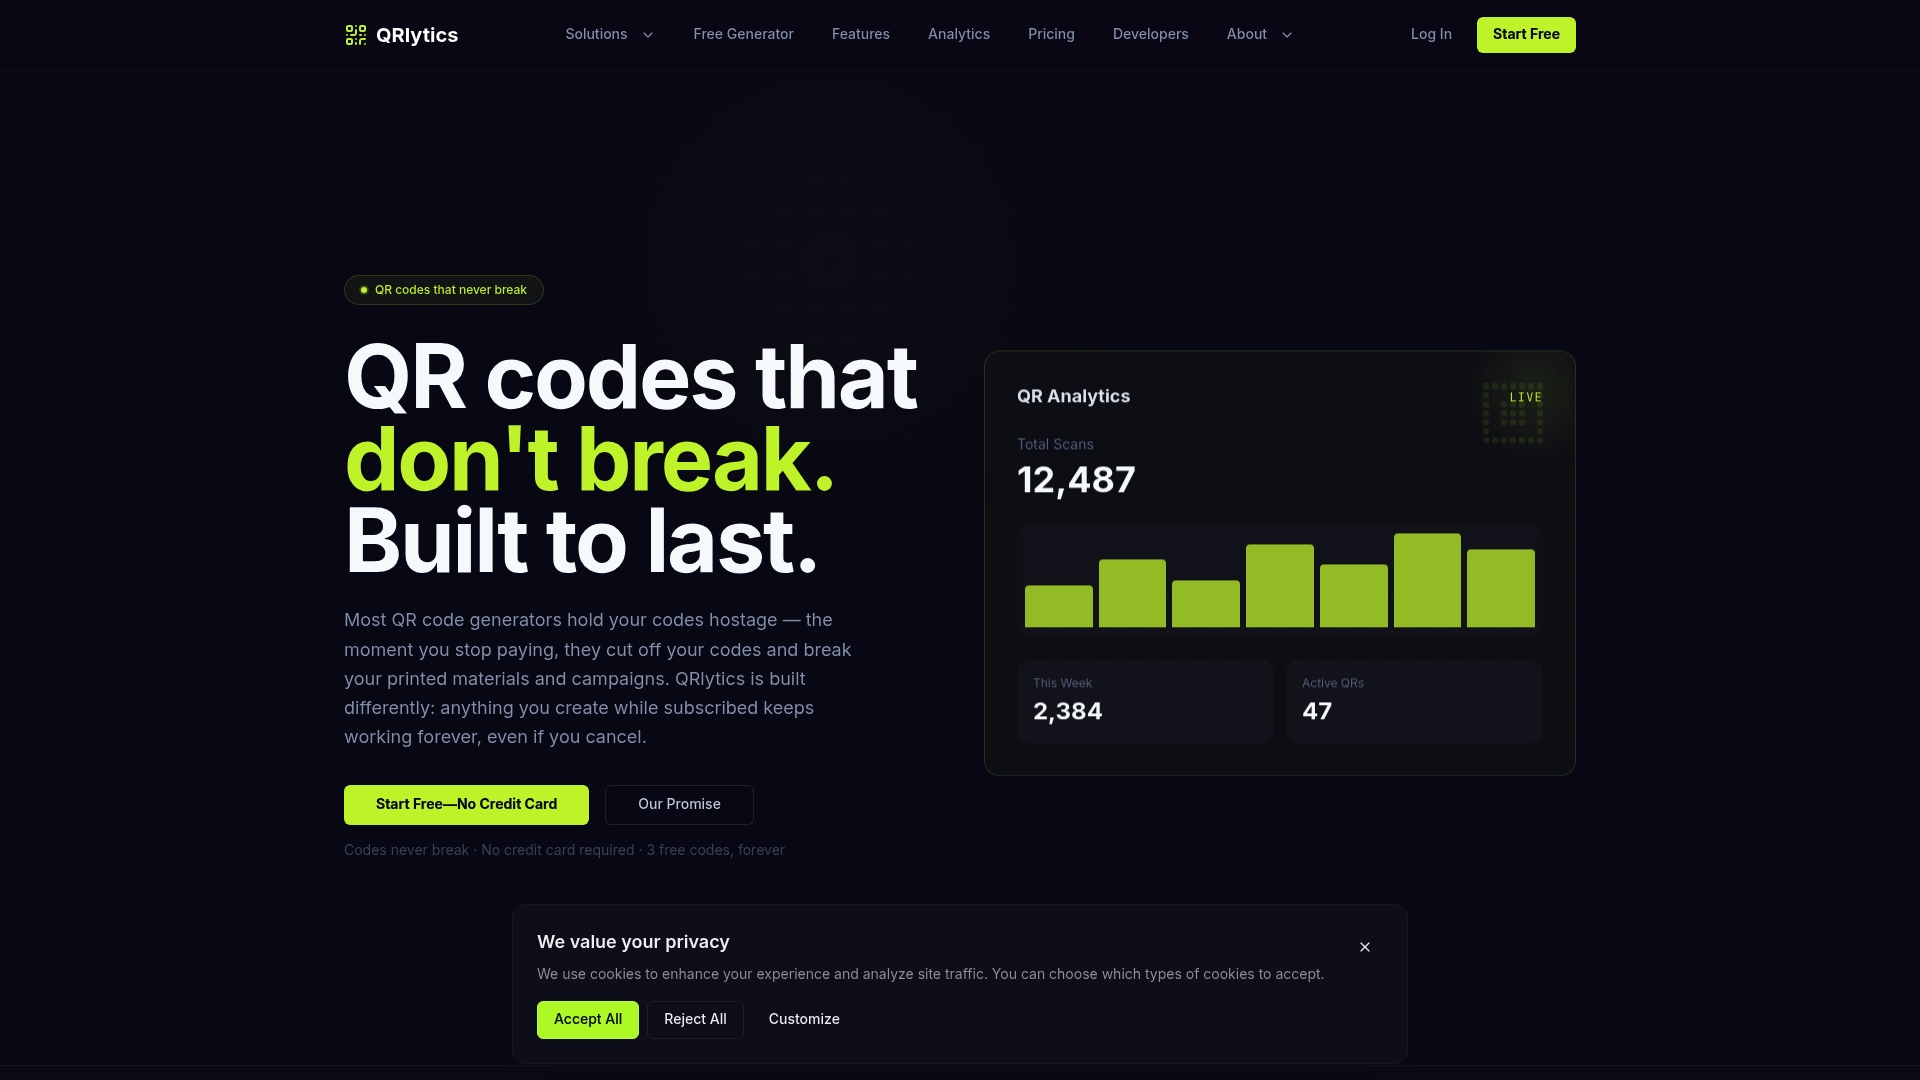
The dynamic QR code generator from Qrlytics captures real-time scan data including device type, location, and timestamp, giving you the context to understand why completion rates rise or fall. The scan analytics dashboard connects scan behaviour to campaign outcomes, so you can identify friction points and fix them quickly. Codes created on Qrlytics remain active regardless of billing status, which means your printed materials never produce a broken scan. No credit card is required to get started.
FAQ
What is a good QR code completion rate?
A completion rate above 15% is considered strong for consumer-facing QR code campaigns, with rates above 10% generally regarded as good. Rates below 5% typically indicate significant friction in the landing page or a mismatch between the offer and the audience.
Why is completion rate more useful than scan count?
Scan counts measure how many people noticed or were curious about a QR code. Completion rate measures how many people took the action the campaign was designed to produce, making it the accurate indicator of campaign success and ROI.
What causes a low QR code completion rate?
The most common causes are slow landing page load times, mobile-unfriendly design, excessive form length, and a mismatch between the QR code’s promise and the landing page content. Technical issues such as broken redirects or expired static codes also reduce completion rates.
Do dynamic QR codes improve completion rates?
Dynamic QR codes do not directly increase completion rates, but they provide the tracking data needed to identify why completion rates are low and fix the underlying issues. Static codes offer no scan data, making optimisation impossible.
How do I track QR code completion rates accurately?
Use dynamic QR codes combined with UTM parameters on your destination URLs. Connect those parameters to an analytics platform to attribute completions and revenue to specific campaigns, placements, and time periods.