Ways to boost QR code scans for marketers
TL;DR:
- Effective QR codes require proper sizing, high contrast, and placement at natural pause points to maximize scans. Using benefit-driven CTAs, dynamic codes, and analytics tracking significantly boost engagement and measure campaign success. Treat QR campaigns as an ongoing experience by testing, refining, and integrating digital tools for continuous improvement.
QR codes are only useful when people actually scan them. Yet many campaigns produce codes that sit ignored on packaging, posters, and menus, generating almost no engagement. If you are looking for practical ways to boost QR code scans and turn printed materials into a measurable marketing channel, this guide is for you. We cover the technical foundations, design tactics, placement strategies, and analytics practices that separate high-performing QR campaigns from ones that quietly fail. Every tip here is grounded in real data, not guesswork.
Table of Contents
- Key takeaways
- Ways to boost QR code scans: start with the fundamentals
- Design and placement strategies that increase QR code usage
- Using analytics to track and improve QR code campaigns
- Comparing QR code strategies: which approach suits your campaign?
- Situational tips for sustained QR engagement growth
- My honest take on why most QR campaigns underperform
- Start building better QR campaigns with Qrlytics
- FAQ
Key takeaways
| Point | Details |
|---|---|
| Sizing and contrast matter most | A 4:1 contrast ratio and the 10:1 scanning distance rule are the baseline for reliable scan rates. |
| Placement drives the majority of scans | Receipts and checkout counters account for the highest scan volumes; location choice outweighs design. |
| Dynamic codes give you flexibility and data | Update destination URLs without reprinting and track scans by location, device, and time. |
| Benefit-driven CTAs outperform generic ones | “Scan for 20% off” consistently outperforms “Scan me” in tested campaigns. |
| Analytics must go beyond raw scan counts | Unique scans, repeat behaviour, and conversion data reveal true campaign ROI. |
Ways to boost QR code scans: start with the fundamentals
Before you experiment with colours and incentives, you need to get the technical basics right. A code that fails to scan reliably will cost you every other optimisation effort you make.
- Follow the 10:1 scanning distance rule. If your code will be scanned from one metre away, it needs to be at least 10 centimetres wide. Codes printed too small on packaging or signage fail routinely, particularly in poor lighting.
- Maintain a high contrast ratio. A 4:1 contrast ratio is the minimum for reliable scanning, with black on white achieving a 94% first-scan success rate. Avoid gradients, pastels, and reversed colours.
- Keep a quiet zone margin. A clear margin of at least 0.25 inches around the code prevents surrounding graphics from interfering with scanner recognition.
- Choose dynamic over static codes. Dynamic QR codes let you update the destination URL without reprinting, track scan counts, device types, locations, and timestamps, and keep campaigns flexible throughout their lifespan.
- Test across devices and environments. Testing across multiple smartphones and lighting conditions before launch is the difference between a campaign with daily scan failures and one that works consistently for every customer.
- Pair every code with a clear call-to-action. A QR code without a CTA is a puzzle. Tell people what they will get and why it is worth pointing their camera at your code.
Pro Tip: Dynamic codes using short redirect URLs produce visually simpler, smaller QR images that are easier to scan and fit naturally on packaging inserts or small labels where space is limited.
Design and placement strategies that increase QR code usage
Once your technical foundations are solid, the next layer of optimisation is how the code looks and where it lives.
1. Brand your QR code visually
Custom branding of QR codes significantly increases scan rates by building trust and recognition. A code with your logo embedded and colours that align with your brand looks intentional rather than suspicious. Customers are far more likely to scan something that looks professionally produced and affiliated with a brand they recognise. Maintain high contrast and keep the central logo under 30% of the code area to avoid disrupting the scan pattern.
2. Place codes at natural pause points
Placement where users naturally pause, such as checkout counters, restaurant tables, and waiting areas, consistently outperforms codes on moving surfaces or fleeting placements like bus adverts. The customer needs a moment of stillness to scan confidently. A table tent at a coffee shop is far more effective than a sticker on a coffee cup lid.
3. Use receipts and checkout counters together
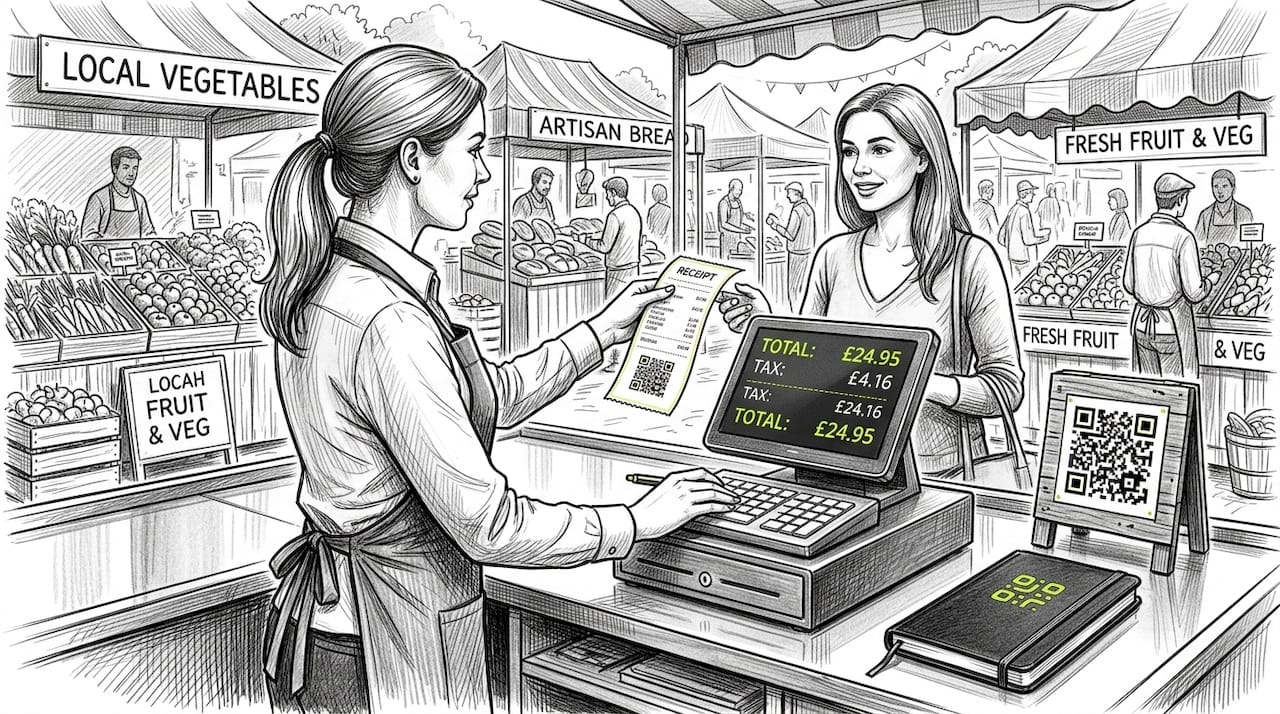
Receipt placement combined with checkout counter display drives roughly 75% of total scans in multi-location retail testing. These two placements work well together because they reach customers at different points of the same transaction. The receipt extends engagement after the purchase is complete, while the counter display prompts action in the moment.
4. Avoid glossy surfaces and reflective finishes
Glare from glossy paper, glass, or laminated surfaces interferes with camera autofocus and produces scan failures. Use a matte finish wherever possible. This is particularly relevant for restaurant menus, retail display stands, and event signage, where shiny materials are common.
5. A/B test your placement and CTA copy
Run two versions of the same campaign in comparable locations and measure which performs better. You can test checkout counter placement against table placement, or test “Scan for your free guide” against “Scan to see this in action.” A/B testing placement and CTA copy has produced up to 300% improvements in review rates in documented cases.
6. Write benefit-driven CTAs
Incentive-led CTAs, such as “Scan for 20% off your next order” or “Scan to watch it work,” can more than double scan rates compared with generic prompts. The psychology is simple: people scan when they understand the specific value they will receive. Vague instructions create hesitation. Concrete benefits create action.
Pro Tip: Adding social proof to your CTA works particularly well for new audiences. Something like “Join 5,000 customers who scan for exclusive offers” removes the uncertainty of being first.
You can find more detailed guidance on creating codes that are built for performance in this marketing pro’s guide to QR codes.
Using analytics to track and improve QR code campaigns
Design and placement get people to scan. Analytics tell you whether any of it is working and where to focus next.
- Go beyond total scan counts. Unique scans and conversion tracking give far better ROI insight than raw totals. A code scanned 200 times by 10 people is very different from one scanned 200 times by 200 unique visitors.
- Use location and tag-based tracking. Assign different codes or tags to different placements so you can compare performance directly. If your event stand out-scans your window display three to one, that tells you exactly where to invest more.
- Add UTM parameters to your destination URLs. This connects scan data to your Google Analytics account so you can trace the full customer journey from scan to conversion. Without UTM parameters, scans appear in your analytics as direct traffic, making attribution nearly impossible.
- Monitor repeat scan behaviour. Repeat scanning reflects growing trust and habit formation. If a segment of your audience scans the same code repeatedly, you have an engaged group worth nurturing with updated content or exclusive follow-up offers.
- Integrate QR scan data with your CRM. Advanced marketers pair QR data with CRM systems to measure how scans convert into leads, sales, or repeat visits. This transforms QR codes from a novelty into a measurable component of your conversion funnel.
A practical reference worth bookmarking is this guide to QR code tracking for marketers, which covers how to structure your analytics setup from the ground up.
| Metric | What it tells you | How to act on it |
|---|---|---|
| Total scans | Volume of engagement with the code | Use as a baseline; combine with other metrics |
| Unique scans | Number of distinct individuals scanning | Measures actual reach of the campaign |
| Repeat scans | Frequency of return visits | Signals loyalty; update content to reward returns |
| Scan location | Where geographically scans occur | Reallocate budget to highest-performing locations |
| Device type | Mobile OS and device breakdown | Optimise landing pages for the dominant device |
| Scan-to-conversion rate | Percentage of scans leading to a desired action | The true ROI metric for any QR campaign |
Comparing QR code strategies: which approach suits your campaign?
Not every tactic applies to every campaign. This table helps you match the right approach to your context.
| Strategy | Best suited for | Implementation complexity | Relative cost |
|---|---|---|---|
| Physical placement optimisation | Retail, hospitality, events | Low | Low |
| Custom-branded QR design | Brand-led or print campaigns | Low to medium | Low |
| Benefit-driven CTA copy | Any campaign with a clear offer | Low | Minimal |
| Dynamic codes with URL updates | Long-running or print-heavy campaigns | Medium | Low to medium |
| UTM tracking and CRM integration | Performance-focused digital campaigns | Medium to high | Low (tool-dependent) |
| A/B testing placement and CTA | Campaigns with multiple placements | Medium | Low |
| Repeat scan and loyalty programmes | Retail, subscription, hospitality | High | Medium |
The most consistent wins come from combining physical placement optimisation with benefit-driven CTAs and dynamic code tracking. The US Chamber of Commerce documented a campaign that delivered over 150,000 QR scans and saved $150,000 in printing costs by using dynamic codes with updated digital content. That combination of flexibility and measurability is what separates well-run QR programmes from ones that stagnate.
Situational tips for sustained QR engagement growth
The strategies above give you a strong foundation. These additional recommendations help you sustain and deepen engagement across different campaign types.
- Retail campaigns: Combine checkout counter placement with a loyalty-linked CTA. Update the destination URL seasonally using a dynamic code so returning customers always find fresh content without you needing to reprint anything.
- Hospitality and restaurants: Table tents with a “Scan to view today’s specials” CTA work well because they align with the customer’s existing mindset. Rotate content regularly to encourage repeat scanning and reduce the feeling that the experience is stale.
- Events and conferences: Use separate codes for different stands, sessions, or collateral so your post-event analytics show exactly which touchpoints drove the most engagement. This data directly informs your next event budget.
- Direct mail campaigns: QR codes on physical mail perform best when the CTA matches the letter’s message precisely. A disconnect between the printed promise and the landing page is a common reason direct mail QR scans fail to convert.
- Train your team. Staff who can briefly explain what the QR code offers remove the hesitation that prevents many customers from scanning. A simple sentence from a sales associate or waiting staff can noticeably improve scan rates.
- Build scan-to-save experiences. Designing QR journeys around saving content for later, such as downloading a voucher or bookmarking a product, creates a reason for the customer to return to the content after the initial scan. This is one of the more underused tactics for building long-term engagement.
- Future-proof with dynamic, trackable codes. Dynamic codes that support updates and real-time tracking keep your campaigns flexible and measurable. If a campaign outlives its original objective, you can redirect it without any physical changes.
For deeper work on using heat maps to understand where your scans are coming from geographically, the Qrlytics resource on heat map analytics is worth your time.
My honest take on why most QR campaigns underperform
I have looked at enough QR code campaigns to see a clear pattern. The ones that fail almost always share the same root cause: the code was treated as a finishing touch rather than a designed experience.
Most teams spend time on the visual design and then stick the code in a corner of a poster. They use a static code because it was quicker to generate. They write “Scan here” because they ran out of time for a proper CTA. And then they measure success by counting total scans once, never revisiting the data again.
The campaigns that genuinely improve over time are run by teams with a testing culture. They assign unique codes to each placement, review the data weekly, and update the destination URL when a page is not converting. They treat a QR code the way a good digital marketer treats a paid search ad: as something to be measured, tested, and refined.
The other point I feel strongly about is the CTA. Generic instructions do not move people. If you cannot articulate in five words what someone will get by scanning your code, you have not thought clearly enough about the offer. “Scan for 20% off today” is a complete sentence with a clear benefit. “Scan me” is not.
Analytics tools like those built into Qrlytics make it straightforward to segment scan reports by unique versus repeat scans, which is where the real intelligence lives. Raw totals are vanity. Unique scans paired with conversion data tell you whether your campaign is actually working.
— The
Start building better QR campaigns with Qrlytics
If you are ready to put these strategies into practice, Qrlytics gives you the tools to do it properly from day one.
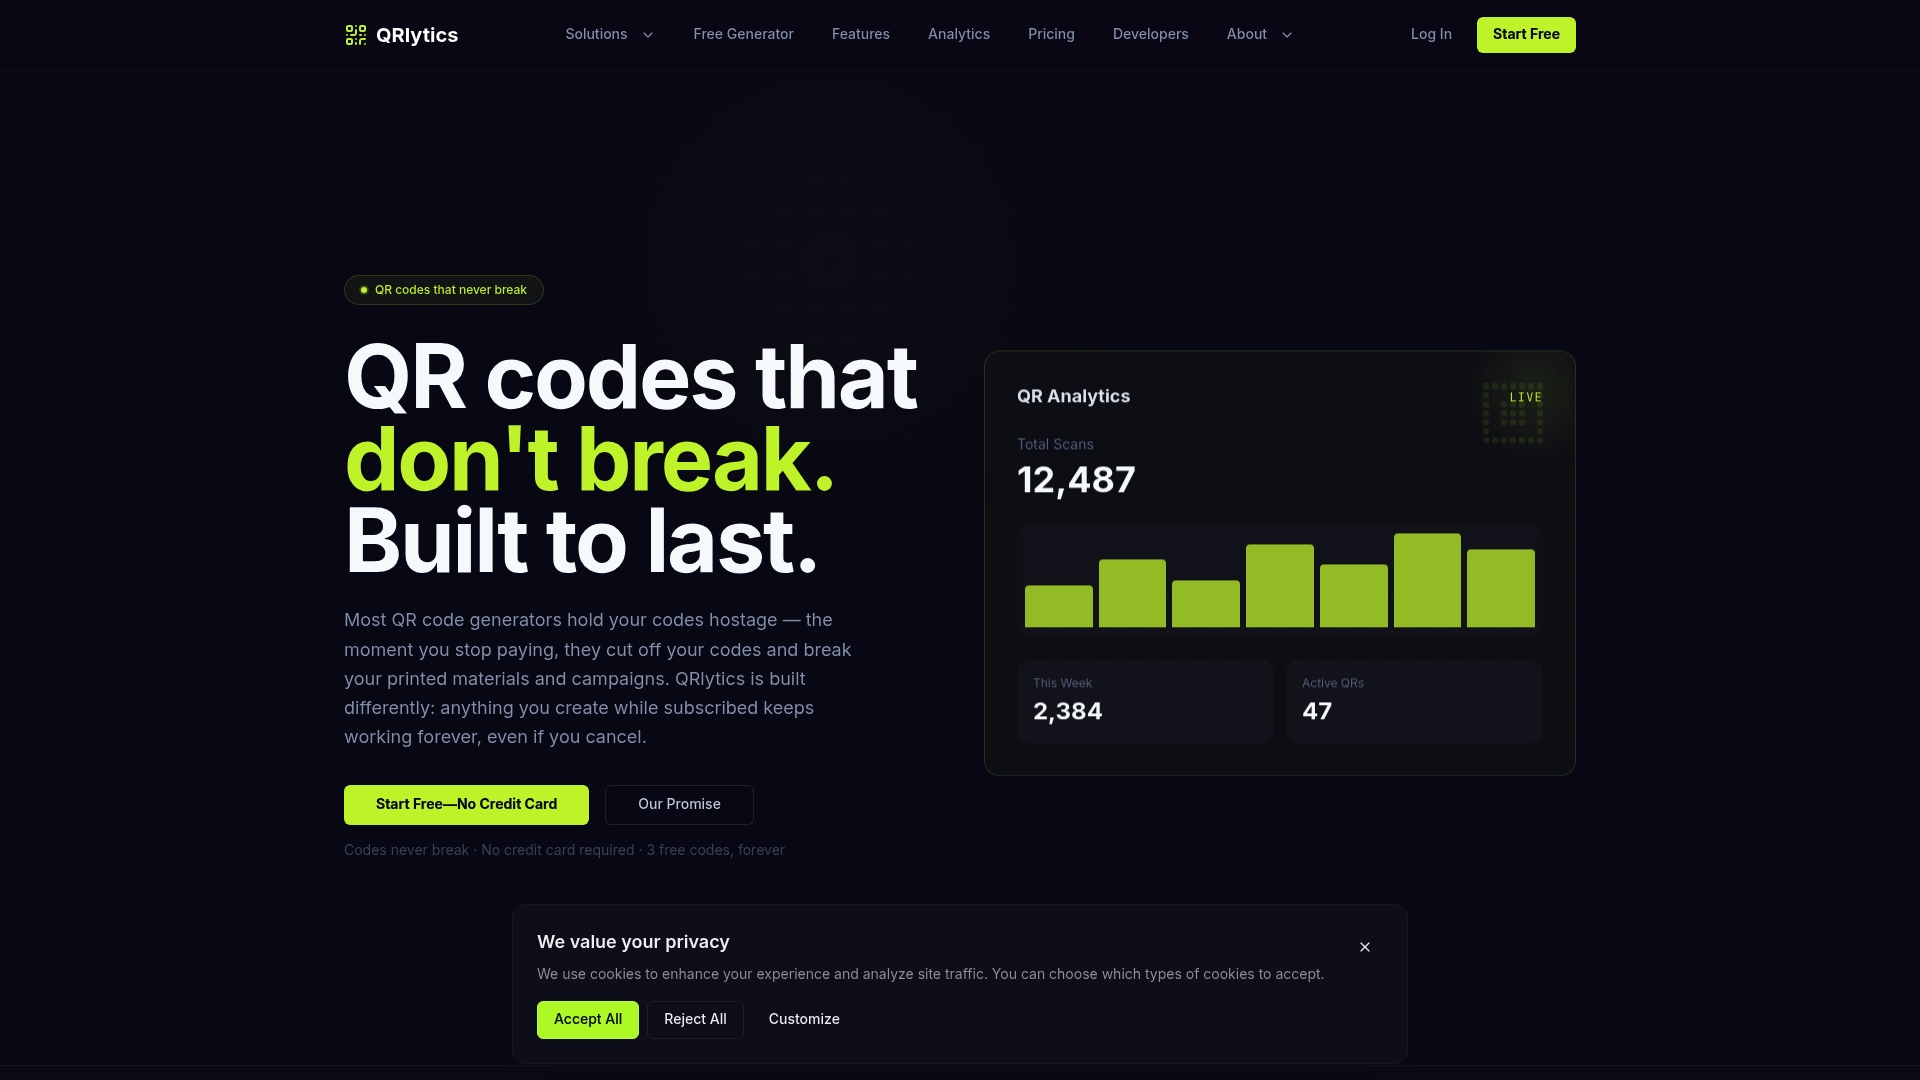
With Qrlytics, you can create dynamic QR codes that allow you to update destination URLs at any time, apply custom branding to build trust, and access real-time analytics covering scan volume, unique visitors, device types, and geographic data. Every code created during an active subscription remains functional permanently, so your printed materials never become dead assets. There is no credit card required to get started, and you can generate your first code in minutes using the free QR code generator. Whether you are running a single campaign or managing codes across dozens of locations, Qrlytics provides the visibility and control you need to improve results continuously.
FAQ
What size should a QR code be for reliable scanning?
Apply the 10:1 rule: the code should be at least one tenth of the maximum scanning distance. For codes scanned from one metre, use a minimum width of 10 centimetres.
Do dynamic QR codes scan differently from static ones?
Dynamic codes use a short redirect URL, which produces a less dense pattern that is often easier to scan, particularly at smaller sizes or in poor lighting.
What is the best placement for a QR code in a retail setting?
Receipt placement combined with checkout counter display drives approximately 75% of total scans in retail testing, making these two locations the most reliable starting points.
How do I measure whether my QR code campaign is working?
Track unique scans, repeat scan behaviour, and scan-to-conversion rates rather than relying on total scan counts alone. Pairing QR data with UTM parameters in Google Analytics gives you full-funnel attribution.
How can I improve QR code engagement without redesigning my printed materials?
Switch to a dynamic code that redirects to an updated landing page with a stronger CTA and a clear offer. You can often improve engagement significantly without any physical changes to existing print assets.