Country-Level QR Analytics: What It Shows and How to Use It

Country-level QR analytics tells you which countries your scans come from, so you can see where a printed campaign is landing and where it is not. It works with dynamic QR codes, which send each scan through a redirect that records it before passing the visitor to your page. We built QRlytics around that redirect, with real-time scan analytics, global heat maps and codes that keep working after a subscription ends, so the data you collect stays tied to materials you have already printed.
This guide explains what country data does and does not tell you, how accurate it is, which other metrics to read beside it, and how to set up a campaign so the numbers mean something.
TL;DR
- Country-level data comes from the scanner’s IP address, and geolocation providers rate this level as far more reliable than city-level data.
- It only works on dynamic QR codes. A static code has no redirect, so nothing is recorded.
- Read country scans next to device, time, scan-to-conversion rate and the specific print placement, not on their own.
- Tag each code’s destination with UTM parameters so your website analytics can show what scanners did after the scan.
- Collect only what you need, and tell people what you collect. Country-level data is a lighter footprint than precise location.
Table of Contents
- What country-level QR analytics actually shows
- Why static codes cannot give you this
- How accurate is country-level location?
- Which metrics to read beside country data
- Setting up a campaign to compare countries
- Connecting country scans to website and conversion analytics
- What the benchmarks say
- Privacy: collect country, not more than you need
- Our perspective: permanence is what makes the data useful
- Start tracking scans by country
- FAQ
- Sources
What country-level QR analytics actually shows
Every time someone scans a dynamic QR code, their phone requests a short redirect address. That request reaches the QR platform first, which logs it and then forwards the person to your destination URL. The log typically holds a timestamp, the device type and an approximate location derived from the IP address (the numerical address a phone or network uses to connect to the internet).
Country-level reporting groups those scans by nation. A typical view is a ranked list or a world heat map: 1,240 scans from the United States, 310 from Canada, 95 from Mexico, and so on. It answers practical questions:
- Did a trade show leaflet reach visitors from abroad, or only the local market?
- Is a packaging code being scanned in the countries where the product actually ships?
- Did a multi-market print run perform evenly, or did one country carry it?
- Are scans arriving from a country you never targeted?
It does not tell you who scanned, which street they stood on or whether they were a customer. It is a distribution view, not a tracking view of individuals, and that is a strength when you need to report to a brand team without collecting anything sensitive.
Why static codes cannot give you this
A static QR code stores the destination directly in the pattern. The phone reads it and goes straight to the page, so your QR platform never sees the scan. Your website analytics will register a visit, but it cannot tell you the visit came from a printed code unless you tagged the link.
A dynamic code stores a short redirect address instead. That is the only reason scans can be counted, broken down by country and, just as usefully, re-pointed to a new destination without reprinting. If country data matters to the campaign, create the code as dynamic before it goes to print. A code that has already been printed as static cannot be upgraded.
Our dynamic QR code generator creates editable, trackable codes, and codes created during an active subscription keep working permanently, even if billing changes later. For a printed run, that matters as much as the analytics: a campaign tracked for three months is useless if the codes stop resolving in month four.

How accurate is country-level location?
QR platforms do not ask the phone for its GPS position. They estimate location from the IP address using a geolocation database, so the accuracy depends on that database and on how the person is connected.

MaxMind, a major supplier of IP geolocation data, publishes its own estimates. It reports 99.8% accuracy at the country level, about 80% at the US state or region level and 66% for US cities within a 50 km radius. The same page states that this data is never precise enough to identify a household, an individual or a street address.
The practical reading for a marketer:
| Level | What you can rely on it for |
|---|---|
| Country | Market-by-market comparison, international reach, spotting unexpected regions |
| State or region | Directional trends, with some noise |
| City | Rough indication only, not for budget decisions on its own |
Country is the level where you can make a decision from the numbers with confidence. That is one reason it is the most useful geographic cut for campaigns that span several markets.
What can distort the picture
The same MaxMind page explains the main sources of error. Mobile-network IP addresses can be used by phones across a large distance, and VPN or proxy addresses may resolve to the server rather than the person. In practice:
- A small share of scans may be credited to the country where a VPN server sits.
- Travellers on roaming plans may appear to scan from their home network’s country.
- Corporate networks can route traffic through a head office in another country.
These effects are usually small next to the differences between markets, so a country that produces 40% of your scans really is your strongest market. Treat very small counts (a handful of scans from one country) as noise, and look for patterns over weeks, not single days.
Which metrics to read beside country data
A country total only becomes useful when you put it next to other numbers. Our guide to tracking from scan to conversion goes through the full set. These are the pairings that matter most for country analysis.
Scans and unique scanners
Total scans count every scan. Unique scans try to count each device once. A country with many scans but few unique scanners may be a single enthusiastic person, a test by your own team or a code on a menu that regulars scan daily. Compare both before calling a market strong.
Device and operating system
If one country skews heavily to one phone platform, your landing page needs to be checked on that platform first. A page that loads slowly on older Android phones will hurt a market where those devices dominate.
Time of scan
Time of day by country shows when each market engages. A code on a poster in a transit station peaks at commute hours, and a product box code peaks in the evening. Convert to local time before you compare, otherwise every country looks as though it scans at odd hours.
Placement or code version
Country data is much more informative when each placement has its own code. If the same destination is printed on a flyer, a shelf-talker and a window sticker, three separate codes show which one works in which country. One shared code hides that.
Scan-to-conversion rate
Scans are attention. Conversions are the outcome: a sign-up, a booking, a purchase. A country with fewer scans but a higher conversion rate may deserve more print investment than a country with a big scan count and no results. This is where website analytics comes in, covered below.
Setting up a campaign to compare countries
The steps below apply whether you run a single product label or a multi-country retail rollout.
- Create a dynamic code for each placement and market. Use one code per meaningful variable: country edition of a flyer, shelf position, event stand. Name each code clearly so reports are readable months later.
- Add UTM parameters to the destination. UTM parameters are tags added to a web address that tell Google Analytics where a visit came from. Google’s documentation explains that you set utm_source, utm_medium and utm_campaign, plus a campaign ID, and recommends setting all the relevant ones together. For a poster code you might use a source of “poster”, a medium of “print” and a campaign name such as “autumn_launch”.
- Test every code before printing. Scan it on both iPhone and Android, on mobile data and on Wi-Fi, and confirm that the final page loads and shows the right language.
- Brand the code and size it for the surface. A clear call to action beside the code tells people why to scan. Our guide to ways to boost QR code scans covers placement and wording.
- Watch the first week closely. Check that scans arrive from the countries you expect. An unexpected region at this stage often points to a wrongly distributed print batch, which you can still fix.
- Compare, then adjust. Review country, device and conversion together. Because the destination of a dynamic code can be changed, you can send one market to a local page or a country-specific offer without touching the print.
- Export for reporting. A CSV export lets you combine QR scan data with sales or CRM figures in your own spreadsheet.
Agencies and in-house teams that manage many codes can also use API access to create and read codes from their own systems; our guide to QR API integration shows how.
Connecting country scans to website and conversion analytics
The QR platform tells you who scanned and from where. Your website analytics tells you what happened next. You need both, and the UTM tags are the bridge.
Once UTM tags are in place, the campaign shows up in Google Analytics’ Traffic acquisition report, where you can see sessions and conversions for that campaign. Add country as a dimension and you can compare the QR platform’s country counts with the website’s. The two will not match exactly, because some people scan and never wait for the page to load, but the shape should be similar. If a country shows many scans and almost no sessions, look for a slow page, a blocked domain or a landing page that does not work in that market.
For the business case, it helps to frame the exercise as a measurement discipline. Teams that tie campaign activity to results can show what each market returns, as this piece on marketing analytics and ROI argues. Country-level scan data is a simple, low-effort starting point for that kind of reporting on printed media.
What the benchmarks say
Hard benchmarks for scan rates by country are scarce, so be careful with any table that promises them. The most solid published figure we can point to for print is older and US-based. A national magazine study reported that readers scanned QR codes and similar mobile action codes at an average rate of 6.4%, against 4.4% for direct mail. The same coverage found that the total number of scannable codes had the strongest effect on response, that discounts, coupons or sweepstakes raised rates, and that repeating a programme across several issues produced higher response over time than a one-off.
The lessons that carry over to your own country comparison:
- Give people a reason to scan. An offer outperforms a bare code.
- Use more than one code in a campaign, with each placement tracked separately.
- Run the campaign more than once. Your own benchmark, built from your previous run in each country, is worth more than any industry average.
For publishers, our guide to QR codes in magazine publishing and the catalogue playbook apply these ideas to issues and mailings.
Privacy: collect country, not more than you need
Country-level reporting suits privacy-minded teams because it avoids storing anything that points to a person. Still, an IP address can count as personal information under some laws, so it pays to be deliberate.
- Be clear about what you collect. Say in your privacy notice that scans are counted and that approximate location is recorded.
- Keep the data aggregate. Report by country and campaign, not by individual device.
- Know your rules. The US has no single federal privacy law for QR codes. State laws such as California’s apply depending on who your customers are and how much data you handle. If you also reach people in Europe, GDPR applies to them. Check with your legal adviser for your specific case.
- Do not add detail you will not use. If you only make decisions at country level, there is no reason to chase city data, which is also the less reliable level.
QRlytics provides GDPR-compliant tracking, and we explain the practical side in our guide to QR data privacy for safer marketing campaigns.
Our perspective: permanence is what makes the data useful
Most advice on QR analytics starts with the dashboard. We start with the code.
A country comparison is only worth having if the codes keep resolving for as long as the printed material is in the world. Posters stay up, catalogues stay in drawers and packaging sits on shelves long after a campaign report is written. If a code stops working when a subscription lapses, the data stops with it, and so does every sale that would have followed.
That is why we guarantee that codes created during an active subscription keep working permanently, whatever happens to billing afterwards. With that in place you can build a multi-year picture: the same code, the same placement, country by country, run after run. That is how a printed item becomes a measurable channel.
Pair that with real-time analytics, global heat maps, scheduling for a code’s lifecycle and a CSV export, and a small team can run a multi-country campaign without a data analyst. We think that is the right standard for anyone who prints a code and expects it to work next year.
The
Start tracking scans by country
If you want to see where your codes are scanned, the quickest route is to create a dynamic code and attach a tracked destination. The Free plan costs $0 per year and needs no credit card, with limited codes and analytics. Pro unlocks unlimited codes, advanced analytics and API access, and its details are on the pricing page.
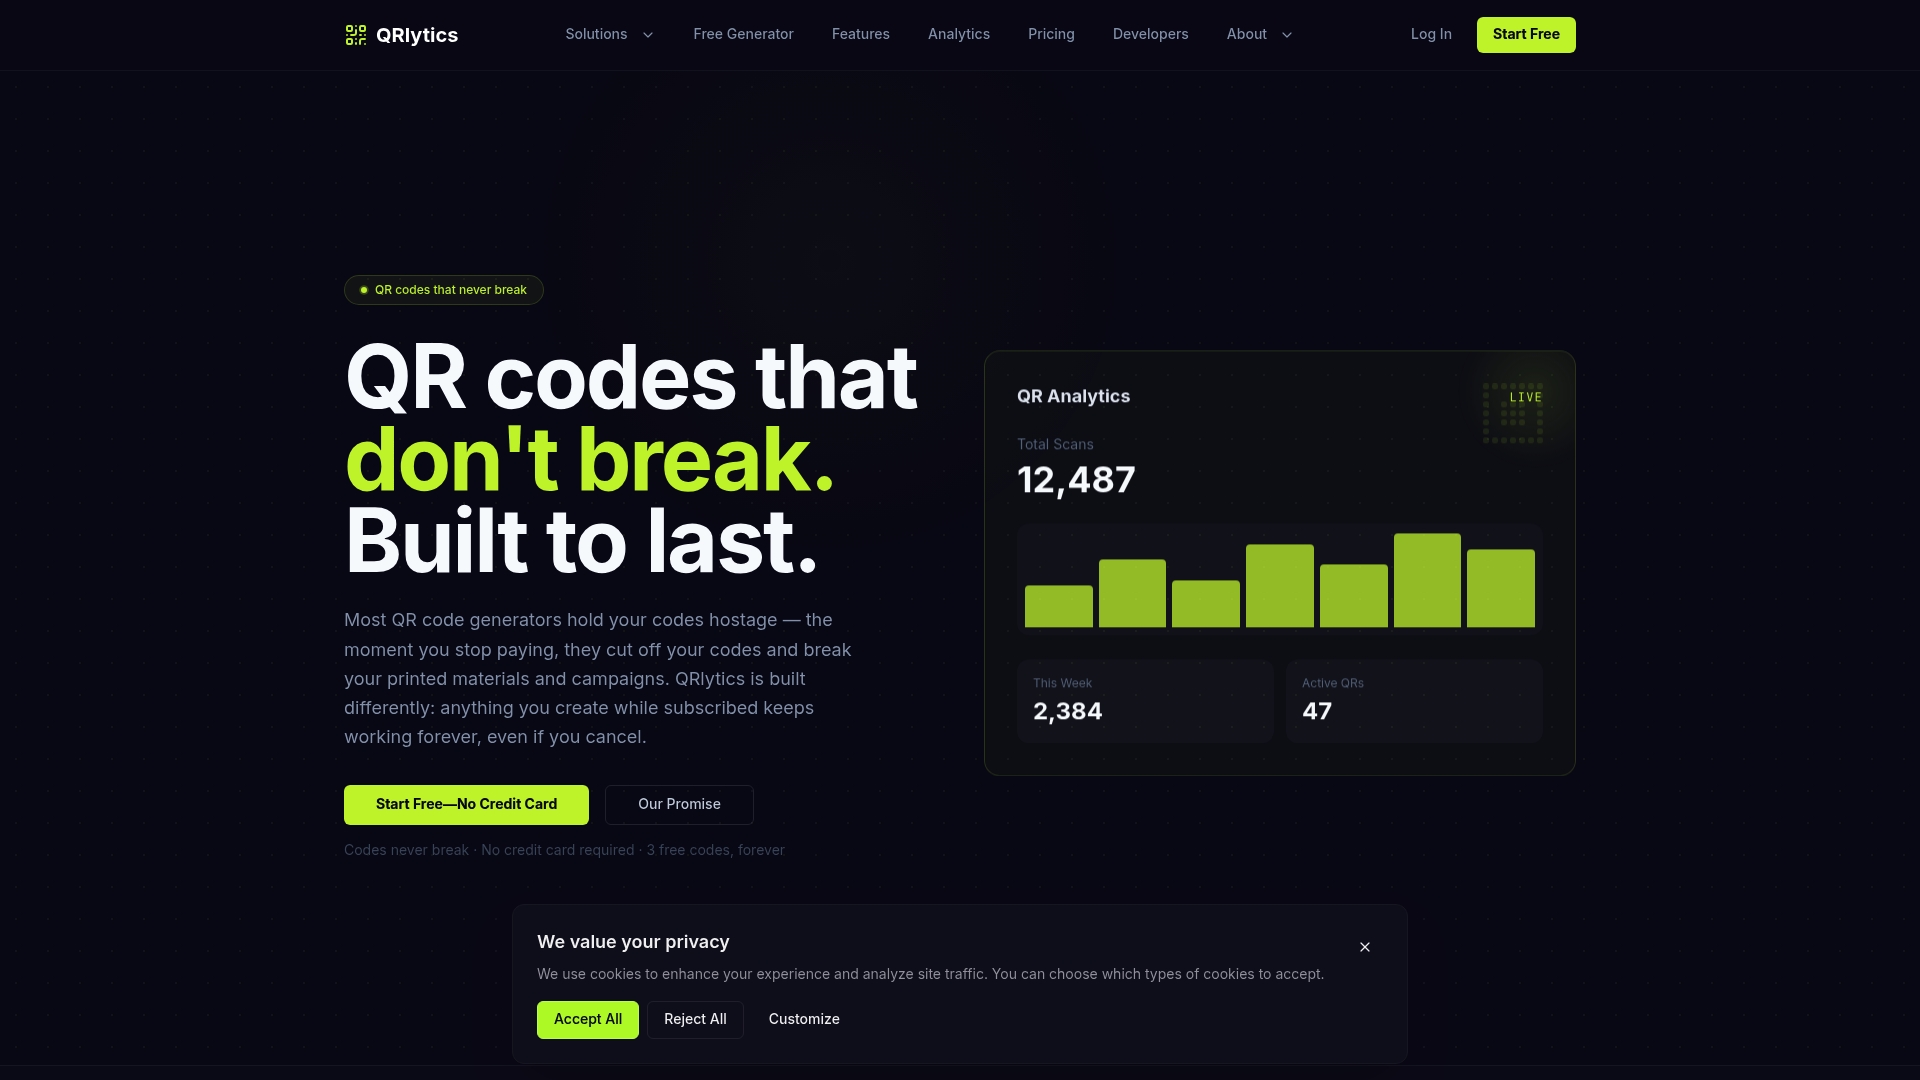
You can see how scan reporting works on our QR codes with analytics page, or start from qrlytics.app. If you also plan to adapt content by location, read our guide to geo-targeted QR marketing.
FAQ
Can I see country-level scan data with a free QR code?
Only if it is a dynamic code created on a platform that records scans. A static code carries no tracking. Our Free plan includes limited codes and analytics, so you can try country reporting before moving up.
How does a QR code know which country someone is in?
It does not ask the phone. The platform reads the IP address from the scan request and matches it against a geolocation database. At country level, one major provider reports 99.8% accuracy.
Why do my QR scans and website visits differ by country?
Some people scan and leave before the page loads, and VPNs or mobile networks can shift a visitor’s apparent country. Small gaps are normal. A large gap in one country is a prompt to check page speed and the destination URL for that market.
Is country-level QR tracking allowed under US privacy law?
There is no federal rule written for QR codes, but state privacy laws can treat IP addresses as personal information. Tell people what you collect in your privacy notice, keep reporting aggregate and ask your legal adviser about your own situation.
Can I change where a code sends people for a particular country?
Yes, with a dynamic code you can change the destination URL after printing. Whether you can serve different pages by country depends on your setup, so see our guide to geo-targeted QR marketing for the options.
Sources
- MaxMind: Geolocation accuracy
- Google Analytics Help: URL builders, collect campaign data with custom URLs
- Marketing Dive: QR codes beat out direct mail in driving response