CSV export for QR analytics: a guide for analysts and marketers

Export your QR analytics as a CSV in two ways: pull it straight from your analytics dashboard, or call the platform API for raw scan rows. Either route gets you a file you can filter, pivot, and join with campaign data within minutes.
Before you touch the export button, do this:
- Apply date and campaign filters so you download only what you need
- Choose CSV over PDF if you plan to analyse rows in a spreadsheet or BI tool
- Schedule an API pull if you need this data on a recurring basis
Qrlytics builds CSV export, API access, and GDPR-compliant tracking into every dashboard, and platforms like GA4 cap Sheets and CSV exports at 100,000 rows, a limit worth planning around before you export a full year of scan data.
Table of Contents
- How do you export QR code analytics as a CSV?
- Can you automate QR analytics exports and scheduling?
- How do you clean and prepare a CSV before analysis?
- What columns appear in a typical QR analytics CSV?
- Why do exports fail or truncate, and how do you fix it?
- Why choose Qrlytics for exporting QR analytics to CSV?
- What experienced analysts get wrong about QR exports
- Try QRlytics for reliable CSV exports and campaign tracking
- Where to find further documentation
- Sources
- FAQ
How do you export QR code analytics as a CSV?
The standard flow across nearly every analytics platform looks the same: open the report, set your filters and date range, then select CSV or Export and either download the file or send it straight to Google Sheets. Ingage’s documentation confirms this pattern, noting that CSV exports give you raw data for spreadsheet analysis, whereas PDF exports mirror the visual report and are far less useful for actual number crunching.
Run through this checklist before you click export:
- Set the date range, matching it to your reporting period rather than a default “last 30 days” window
- Filter by campaign or QR code ID if you only need a subset of your codes
- Pick CSV (or ZIP, if the platform bundles multiple files) rather than PDF
- Confirm which fields are included, since some dashboards let you toggle columns before export
- Check the row limit for your plan tier before assuming you have the full dataset
Inside Qrlytics, saved reports live under your dashboard’s reporting tab, and the export menu offers a straight CSV download alongside a PDF option for stakeholder summaries. One detail that trips up a lot of analysts elsewhere: Qrlytics preserves whatever filters you had applied on screen, so the exported file matches exactly what you were looking at, not a fresh unfiltered pull. That mirrors how Universal Analytics handled exports too. Use CSV rather than PDF whenever you need session-level or scan-level rows for deeper analysis; PDF is fine for a client summary, but it won’t give you anything you can pivot.
Pro Tip: Check your timezone setting and date format before exporting. A file that looks correct can silently shift every timestamp by several hours if your dashboard timezone doesn’t match your analysis tool’s default, and that mismatch is brutal to spot after the fact.
Can you automate QR analytics exports and scheduling?
Yes. Use scheduled exports or the API to remove the manual download step entirely, particularly if you’re producing the same report weekly or monthly.

Most dashboards handle scheduling the same way: pick the report, set a schedule, choose recipients, and the platform emails a CSV (sometimes as a password-protected ZIP) on that cadence, as explained in this client marketing report guide. Hootsuite’s export documentation notes that scheduled exports vary by plan and that CSV/XLSX exports can arrive as a ZIP containing separate files per metric type, which catches people off guard the first time they receive one.
API access is the more flexible route for analysts who want raw data on demand rather than a fixed schedule. You’ll typically need:
- An API key or token for authentication
- The scan-rows endpoint (versus a summary or aggregate endpoint)
- Pagination handling, since large datasets rarely return in one call
- A defined output format request (CSV or JSON)
Before automating anything, confirm your credentials, chosen format, delivery frequency, recipient list, and storage location, whether that’s an S3 bucket, a shared drive, or a database staging table.
Pro Tip: If you don’t want to build custom infrastructure, export to Google Sheets and trigger a simple Apps Script or scheduled task to pull that data into your BI pipeline. It’s a low-effort bridge that works well for teams without dedicated engineering support.
How do you clean and prepare a CSV before analysis?
Normalise your timezone, parse timestamps into ISO format, and standardise campaign tags immediately after export, and the rest of your analysis moves faster because you’re not fighting inconsistent formatting mid-pivot.
Run every fresh export through this checklist:
- Convert timestamps to ISO 8601 and lock in one consistent timezone
- Flag or remove duplicate rows, especially if you’ve pulled overlapping date ranges
- Standardise UTM and campaign field naming, since inconsistent tags silently fragment your groupings
- Normalise device and platform labels (iOS vs. ios vs. iPhone should collapse into one value)
Joining exported scan rows to a campaign table is where the real analytical value shows up. Map each QR code ID to its campaign name, creative version, physical location, and any offline tags you’ve assigned, so a raw scan row becomes a fully attributable data point.
| CSV column | Recommended analysis field |
|---|---|
| timestamp | event_time_iso |
| code_id | qr_id |
| geo | country / region |
| referrer | ref_domain |
| device | device_type (normalised) |
For pivot-ready analysis, keep raw scan rows rather than pre-aggregated exports wherever possible. Aggregated files are fine for a quick summary, but they strip out the granularity you need for cohort or geographic breakdowns later. Consistent naming across campaigns, something covered in more depth in why QR code consistency matters for marketers, pays for itself the moment you try to join two months of exports together.
What columns appear in a typical QR analytics CSV?
Expect a row containing a timestamp, a QR code ID, campaign name, location data, device and platform, referrer, and any custom event properties the platform tracks.
Here’s what each column typically means and how you’d use it:
- timestamp: when the scan occurred, usually in UTC or your account’s set timezone
- qr_id / code_id: the unique identifier for the specific QR code scanned
- campaign: the campaign or batch the code belongs to, if tagged
- location: city, region, or lat/long coordinates from the scan’s IP or device data
- device: mobile, tablet, or desktop
- platform: iOS, Android, or other operating system
- referrer: where the scan originated, useful for print vs. digital placement comparisons
- custom properties: any additional tags you’ve attached, like a store ID or event name
A representative row might read: 2026-03-14T09:32:00Z, QR-4471, spring-launch, London-UK, mobile, iOS, print-poster. From that single row, you can calculate scan-to-conversion rate once you join it against a downstream event, or measure completion rate the way outlined in why QR code completion rate matters for marketers.
Some platforms export several CSVs bundled inside one ZIP, separating engagement, session, and conversion metrics into distinct files, a pattern Hootsuite documents for its own exports.
Row limits to plan for: GA4 exports to CSV or Google Sheets cap out at 100,000 rows. If your campaign generates more scans than that in your chosen date range, split the export by week or month rather than assuming the file captured everything.
Why do exports fail or truncate, and how do you fix it?
When an export truncates or fails outright, check your filters, date range, plan-level limits, and whether the platform is bundling multiple files into a ZIP you haven’t unpacked yet.
Common culprits include:
- Visualisations like heat maps that only export to PDF, not CSV, because they’re rendered as images rather than data tables
- Export size limits tied to your plan tier
- Authentication timeouts on API calls that pull large date ranges in one request
- Missing columns because a chart type simply doesn’t carry that field into export
Fixes are usually straightforward: paginate your API pulls instead of requesting everything at once, split exports by time slice or campaign, or check whether your platform offers a full-history export separate from the quick dashboard download. Plausible’s approach is a good model here: quick exports are capped per file, but a full export can be queued from account settings, and a stats API exists for anyone who needs complete historical data on demand.
Pro Tip: Before trusting a large export, run three quick checks: does the row count roughly match what the dashboard showed on screen, do the minimum and maximum timestamps fall inside your requested range, and does a spot-check of five random rows match what you’d expect. That takes two minutes and catches most silent export errors before they reach a client report.
Why choose Qrlytics for exporting QR analytics to CSV?
Qrlytics is built for this exact workflow: saved report templates, raw scan-row CSV exports, API endpoints for programmatic pulls, and GDPR-compliant tracking baked into every account.
Specific features worth knowing about:
- Saved report templates so you’re not rebuilding filters every reporting cycle
- Raw scan row exports, not just aggregated summaries, for genuine row-level analysis
- API access for teams pulling scan data directly into a warehouse or BI tool
- The ability to update a QR code’s destination without invalidating the printed code, so your historical scan data stays attached to one stable ID
Analysts use this for recurring client reporting, joining scan rows against CRM records to attribute conversions, and running geospatial heatmap analysis once the CSV lands in a mapping tool.
Codes created during an active Qrlytics subscription keep working permanently, regardless of billing status, so the scan history tied to a printed poster or product label never disappears because a plan lapsed.
Real-time analytics and heatmaps mean you can sanity-check a campaign visually before committing to a full export, which saves a wasted pull on a dataset that turns out to be too small to bother with.
What experienced analysts get wrong about QR exports
Small investments in naming conventions and campaign metadata pay off disproportionately once you’re joining CSV exports at scale across dozens of campaigns.
The single most common mistake is treating each export as a one-off rather than designing a naming schema up front. Tag every QR code with a consistent campaign, location, and creative identifier before it goes to print, not after, because retrofitting metadata onto scan history that’s already accumulated is far harder than doing it correctly the first time.
Pro Tip: Keep a single master campaign table outside your analytics platform, mapping every QR code ID to its metadata. Every CSV export then joins cleanly against it, no matter how the export itself is formatted.
(Author credentials and relevant case studies can be added here.)
Try QRlytics for reliable CSV exports and campaign tracking
Getting from “I need this data” to a clean, analysis-ready CSV shouldn’t take a support ticket or a workaround. Qrlytics gives you saved report templates, raw scan-row exports, and API access in one dashboard, so you’re not stitching together a PDF export and a separate spreadsheet just to get campaign data into a usable shape.
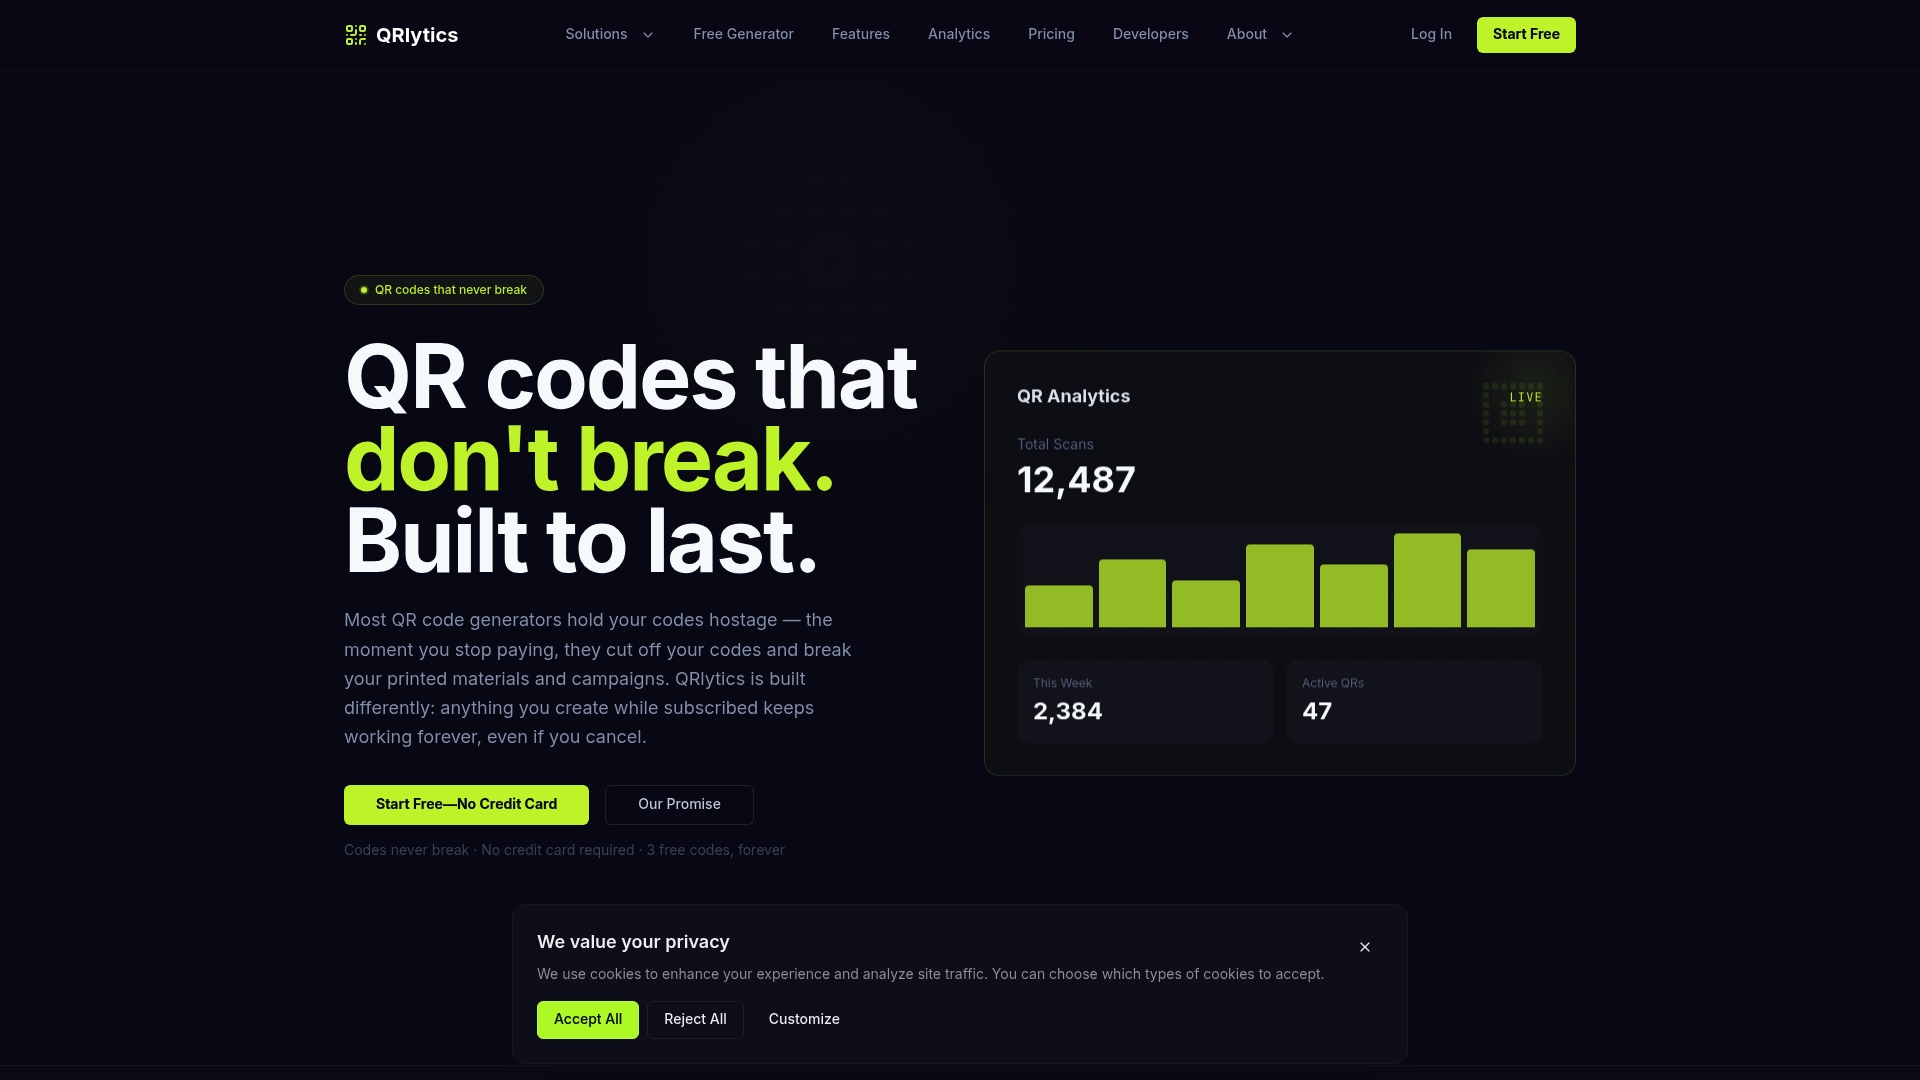
The free tier lets you create a limited number of codes and run basic CSV exports, enough to test whether the field structure matches what your reporting pipeline expects. When you need scheduled exports, full API access, or unlimited codes, upgrading unlocks all of it without touching your existing QR codes or losing scan history. Start with the free QR code generator, export a sample CSV, and check the columns against your own field mapping before deciding whether to move to a paid plan. If you’re specifically after scan-level tracking and export detail, the QR codes with analytics page walks through what’s captured in every export.
Reliable CSV exports depend on consistent campaign tagging and a platform that never breaks your codes mid campaign.
| Point | Details |
|---|---|
| Export format matters | Use CSV for raw, row-level analysis; reserve PDF for visual stakeholder summaries. |
| Plan for row limits | GA4 caps CSV and Sheets exports at 100,000 rows, so split large date ranges by week or month. |
| Clean before you analyse | Normalise timestamps to ISO, standardise campaign tags, and deduplicate rows straight after export. |
| Automate recurring pulls | Use scheduled exports or an API endpoint rather than manually downloading the same report repeatedly. |
| Qrlytics supports the full workflow | Saved reports, raw scan-row CSV exports, API access, and GDPR-compliant tracking are built into the platform. |
Where to find further documentation
- Plausible’s export docs for ZIP exports and the stats API
- Qrlytics’s QR code tracking page for column definitions and reporting features
Sources
- Exporting and Saving Analytics Reports | Ingage Knowledge Base
- Export an Analytics report
- Export your website stats | Plausible docs
FAQ
What is the fastest way to export QR analytics as a CSV?
Open your analytics dashboard, set your date range and campaign filters, then choose CSV export rather than PDF. In Qrlytics, saved reports keep those filters applied so the download matches exactly what’s on screen.
How many rows can I export in one CSV file?
It depends on the platform. GA4 caps CSV and Google Sheets exports at 100,000 rows, so split larger date ranges by week or month to avoid silent truncation.
Can I automate QR analytics exports on a schedule?
Yes. Most platforms, including Qrlytics, support scheduled CSV exports and API access for recurring or on-demand pulls, removing the need to manually download reports each cycle.
Why does my exported CSV show fewer scans than the dashboard?
This usually means a filter, date range, or plan-level row limit was applied during export. Reproduce the report on screen first, confirm the filters match, then re-export a smaller date range to check for truncation.
Does Qrlytics support GDPR-compliant CSV exports?
Yes. Qrlytics tracks scans with GDPR-compliant methods built into the platform, so exported CSVs reflect data collected under that same compliance standard.