Track Scan to Conversion: QR Analytics & Campaign Sheet for Marketers
Scan counts alone tell you almost nothing about whether a QR code campaign worked. The metric that matters is scan-to-conversion rate, and you can only measure it with dynamic QR codes, UTM parameters, and a defined conversion event. Beyond that, track unique scans, landing-page sessions, and the primary outcome you set out to drive. The setup, in one line: a dynamic redirect, a consistent UTM scheme, and a conversion event registered in your analytics platform.
TL;DR:
- Using dynamic QR codes with consistent UTM parameters and a defined conversion event is essential to accurately measure scan-to-conversion rates.
- Tracking unique scans, device and location data, and monitoring engagement metrics helps distinguish genuine interest from inflated scan counts.
- Proper setup includes verifying redirect chains, avoiding shared codes across placements, and conducting pre-launch tests to ensure data accuracy.
- Permanent QR codes with guaranteed longevity prevent data loss and broken links, especially for long-term assets like packaging or signage.
- Small teams should focus on disciplined UTMs and one code per placement, while enterprise programs need layered governance and server-side tracking for large-scale control.
Table of Contents
- Checklist: QR code analytics metrics for campaign managers
- Core QR code metrics: what to measure and why
- How to measure QR code analytics: setup and GA4 wiring
- Why your scan numbers and web analytics never quite match
- Operational best practice for QR measurement
- A reusable measurement framework for QR campaigns
- Why permanent codes protect your measurement data
- Small teams versus enterprise programmes: where to focus first
- Try a tracked QR code before your next print run
- Further resources for setting up QR measurement
- Sources
- FAQ
Checklist: QR code analytics metrics for campaign managers
Before the theory, here’s what to action this week if you’re running or auditing a QR campaign.
Setup checklist:
- Use dynamic QR codes for every campaign, never static ones printed straight from a free generator
- Append
utm_medium=qrconsistently across every code, so QR traffic can be isolated from other channels - Create one code per physical placement, never one code reused across a poster, a flyer, and a receipt
- Define a conversion event before launch (a purchase, a form fill, a sign-up) and register it in your analytics tool
- Verify the full chain works with a live smoke test before printing anything at volume
Prioritisation by team size:
- Small teams (one or two marketers): get UTMs and one-code-per-placement right first. This alone covers most measurement needs without extra tooling.
- Mid-size teams: add platform-level scan analytics (device, location, time-of-day) on top of UTMs to spot placement issues faster.
- Enterprise programmes: layer in server-side capture and API exports for governance across dozens or hundreds of live codes.
Expect a gap between scan counts and landing-page sessions. Some scans never load the page, some load it twice, and some come from someone forwarding a screenshot rather than scanning the physical code. A gap of 5 to 15 percent between scans and sessions is normal. Anything wider usually points to a redirect problem, not a measurement problem, so check your redirect chain before assuming your audience is disengaged.
Core QR code metrics: what to measure and why
Every metric a QR platform reports falls into one of two categories: exposure signals (what happened at the code) and outcome signals (what happened afterwards). Confusing the two is the single biggest reason marketers misjudge a campaign’s performance.
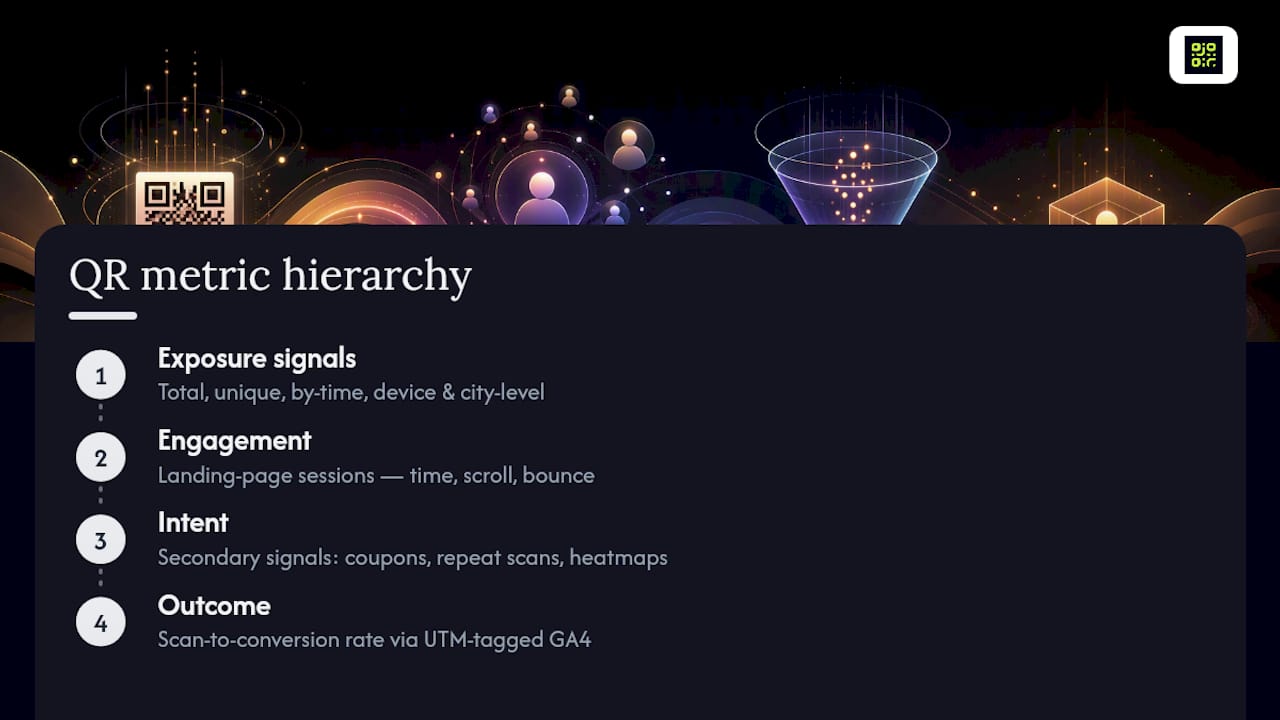
Total scans. The raw count of times a code was triggered. Useful as a headline number, but it inflates easily. The same person rescanning out of habit, a colleague testing the code before it goes live, and occasional bot activity from security scanners all count as scans without representing a single new prospect.
Unique scans. Platforms infer uniqueness from device or session identifiers rather than confirmed identity, so treat this as a strong estimate rather than an exact count. It’s the better number for judging genuine reach.
Scans by time. Plotting scans across hours and days reveals when a placement actually gets noticed. A flyer that scans heavily in the first 48 hours and then flattens tells you something different from one with a slow, steady trickle. Use this to decide how long a placement is worth running before you rotate the creative.
Device and OS split. iOS and Android split can shift where you put design effort. If a placement skews heavily to one operating system’s native camera app, that changes how much you need to worry about third-party scanner apps mangling your redirect.
Location (city-level). Standard QR platforms report location down to city, rarely more granular, and this is a privacy safeguard as much as a technical limit. Treat city-level geolocation as directional, useful for confirming a poster is being scanned in the right region, not as a tool for individual tracking.
Landing-page sessions and engagement. Time on page, scroll depth, and bounce rate tell you whether the page the code sent people to actually held attention once they arrived.
Scan-to-conversion rate. Defining a conversion event, form submission, purchase, or booking, and tying it to UTM-tagged QR traffic in GA4 lets you calculate this directly: conversions divided by scans, filtered to that specific placement.
Secondary signals. Coupon redemptions, repeat scanners, and heatmap density all add colour once the primary metrics are in place. A heatmap showing scans clustered near a shop’s till rather than its window display can change where you physically put the next print run.
The metric hierarchy that actually matters: exposure leads to engagement, engagement leads to intent, and intent leads to outcome. Scans sit at the exposure end. If your reporting stops there, you’re measuring the easiest thing to count, not the thing that pays the bills.
How to measure QR code analytics: setup and GA4 wiring
Static QR codes cannot be tracked or redirected once printed, which rules them out for anything you intend to measure. Dynamic QR codes allow the destination to be updated after printing and support proper scan tracking, making them the baseline for any serious campaign.
Here’s the setup sequence:
- Generate a dynamic QR code pointing at a tracked URL, not the bare destination link.
- Build your UTM string. Use
utm_sourcefor the physical channel (poster, packaging, business card),utm_medium=qrevery time without variation,utm_campaignfor the specific push, andutm_contentfor the placement ID (e.g.storefront_window_01). Documenting this naming convention once and reusing it covers most of the measurement work most teams need. - Choose your redirect architecture. A platform-managed redirect gives you scan analytics automatically; a plain short link with UTMs works but leaves scan-level data (device, location, timestamp) uncaptured; a direct URL with no redirect layer gives you nothing beyond whatever your web analytics already logs.
- Wire GA4. Map your UTM fields to
session_sourceandsession_medium, then create a conversion event for your primary KPI, whether that’s a purchase completion or a lead form submit. - Smoke-test before printing. Scan the physical proof with three different devices and confirm the session and UTM parameters land correctly in GA4’s real-time report.
Pro Tip: Ad blockers and privacy browser modes can strip client-side tracking scripts before they fire. If a placement is high-value (a packaging run printed in bulk, a permanent in-store fixture), server-side capture at the redirect layer is worth the extra setup, because it logs the scan event before the browser has a chance to block anything.
For teams building this out for the first time, a step-by-step tracking guide walks through the GA4 mapping in more detail.
Why your scan numbers and web analytics never quite match
QR analytics live in two layers, and they measure different moments. The scan-layer number, logged by the QR platform, records the instant a camera reads the code. The session-layer number, logged in GA4 or your web analytics tool, records the instant a browser actually loads the landing page and, later, completes a conversion event. These two layers rarely match exactly, and that’s expected, not a fault.
Why the gap happens:
- Some camera apps pre-fetch the URL to generate a link preview, registering a scan without a genuine visit
- A scan can get shared as a screenshot or forwarded link, generating a session with no matching scan
- Redirect chains (QR platform to short link to final landing page) can lose parameters if one hop in the chain isn’t configured to pass them through
- Ad blockers suppress some client-side analytics tags before they fire
- There’s often a delay of minutes or hours between the scan and the actual conversion, which can push the two events into different reporting windows if you’re checking daily figures
Reconciling the two: align your reporting windows so you’re comparing the same date range on both sides, break the numbers down by device to spot whether the gap is concentrated on one OS (often a sign of camera pre-fetch behaviour), and periodically run a manual trace, scan the code yourself, and follow it through to the landing page to confirm every parameter survived the journey.
There’s no universal benchmark for what a “good” scan-to-conversion rate looks like, because it depends heavily on placement and intent (a receipt-printed loyalty code behaves nothing like a billboard code). Judge a placement against its own historical performance and against comparable placements in the same campaign, not against a generic industry number.
Operational best practice for QR measurement
Getting the metrics right depends more on discipline than tooling. A few rules prevent most of the failures marketers run into.
- One QR code per placement, always. Treating a single code as one data point across multiple touchpoints is one of the most common measurement mistakes; a shared code across a shop window, a flyer, and a receipt makes it impossible to know which one actually drove the scan.
- Version control long-lived assets. Packaging that stays on shelves for months needs its code and destination logged with a launch date, so a future update doesn’t silently break historical comparisons.
- Keep a master campaign sheet with tracked URL, UTM string, placement ID, landing page, and the KPI it’s meant to drive, updated the moment a new code goes live.
- Match review cadence to channel. Event codes need a 48 hour smoke test followed by weekly monitoring; packaging and other long-run assets need monthly or quarterly review windows instead, since the sample size simply isn’t there after two days.
- A/B test on scan-to-conversion rate, not raw scans. Two versions of a poster might scan at similar volume while one converts at twice the rate. That’s the version worth reprinting.
- Avoid device fingerprinting or collecting personal data you don’t need. City-level location and anonymised device data cover almost every marketing use case.
Pro Tip: Keep your master campaign sheet in a shared spreadsheet or lightweight dashboard, not buried in individual platform exports. When you’re comparing 40 placements across a national campaign, a single source of truth saves hours at reporting time.
A reusable measurement framework for QR campaigns
Every QR code you launch should be able to answer five questions before you print it: where it will be seen, who’s likely to see it, what action you want them to take, what actually happened after the scan, and what you’ll compare it against. This five-question structure keeps campaign sheets consistent enough to compare placements against each other, rather than treating every code as a one-off.
The fields worth storing for every code, whether in a spreadsheet or a dashboard:
| Field | Purpose |
|---|---|
| Tracked URL | The dynamic redirect destination assigned to the code |
| UTM string | Full source/medium/campaign/content parameters |
| Placement ID | Unique identifier for the physical location |
| Landing page | Where traffic lands after the redirect |
| Primary KPI | The conversion event this code is meant to drive |
| Launch date | When the code went live, for time-window comparisons |
Scan-to-conversion rate is simply conversions divided by scans for that placement, filtered by its unique UTM content value. Report it three ways: placement-level (which specific location performs best), campaign-level (how the whole push is doing against its KPI), and time-windowed (is performance improving, flattening, or declining week over week). A practical ROI framework can help translate these numbers into a business case for future print runs.
A weekly report needs little more than scans, sessions, and conversion rate per placement. A campaign-close report should add the full comparison against launch-week performance and a note on which placements to keep, retire, or redesign.
Why permanent codes protect your measurement data
Link rot is the quiet killer of QR analytics. A code that stops resolving, because a subscription lapsed, a service shut down, or a free generator deactivated it, doesn’t just lose you future scans. It severs the historical data trail for every scan that already happened, and it turns a printed asset, a packaging run, a billboard, a permanent shop fixture, into dead weight the moment the redirect breaks.
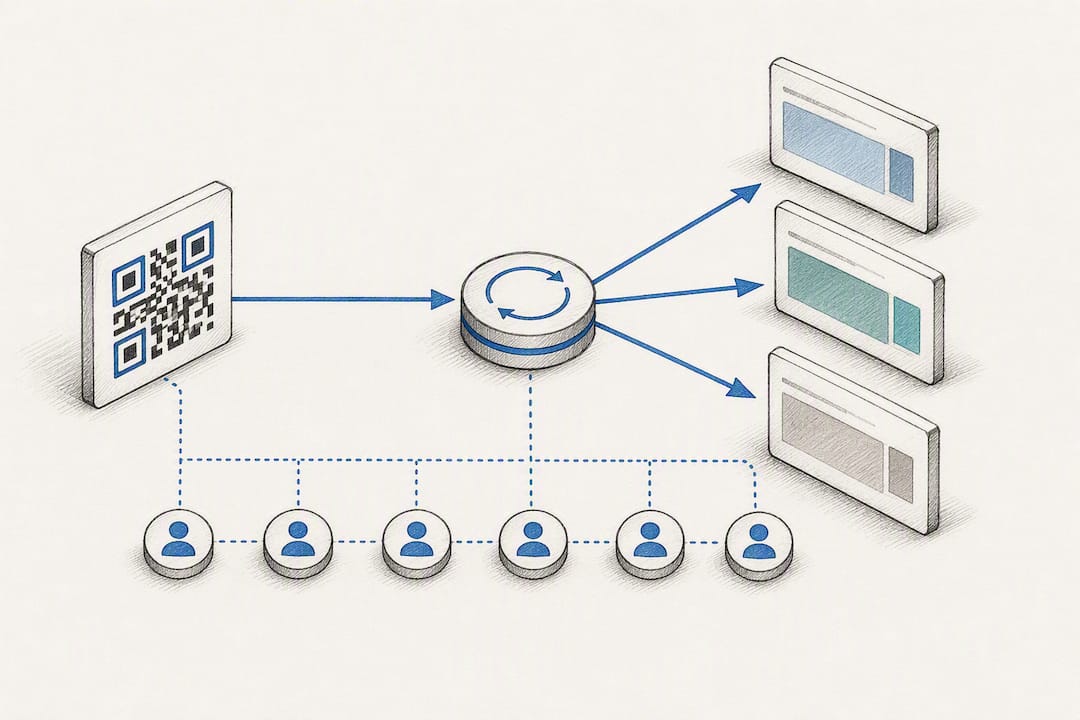
Certain QR code platforms address this directly by guaranteeing that codes created during an active subscription keep working permanently, regardless of later billing status. That guarantee matters more for measurement than it first appears, because a broken code doesn’t just stop new scans; it makes every historical comparison in your campaign sheet unreliable, since you can no longer verify the redirect chain that generated the earlier numbers.
Beyond permanence, the features that reduce operational risk for a marketing team include:
- Dynamic URL updates, so a destination can change without reprinting the physical code
- GDPR-compliant tracking that keeps location and device data anonymised
- Global scan heatmaps for spotting geographic concentration at a glance
- CSV export and API access, so scan data can feed into existing dashboards rather than living in a separate silo
For a packaging run printed months in advance or a permanent in-store fixture, that combination means no reprints when a destination changes and no gaps in the data when a subscription cycle turns over.
Small teams versus enterprise programmes: where to focus first
If you’re a lean marketing team, resist the urge to build a complex tracking stack on day one. Get UTMs consistent and one-code-per-placement disciplined first. That covers most of what you need before server-side capture or API integration earns its complexity.
Enterprise programmes running dozens of live codes face a different problem: governance. Permanent-code guarantees and API exports matter more than any single metric, because the real risk is losing control of which code points where. The trade-off is speed versus reliability. Move fast on testing creative and placement, but treat the underlying redirect infrastructure as something you don’t want to touch twice.
*— The *
Try a tracked QR code before your next print run
If you’ve been burned by a free QR generator that deactivated a code mid-campaign, you already know why permanence matters for measurement. Some QR code platforms are built for exactly that failure point: codes created during an active subscription keep redirecting forever, so a packaging run, an event series, or a permanent shop fixture never loses its data trail because of a lapsed subscription or a shut-down free tool.
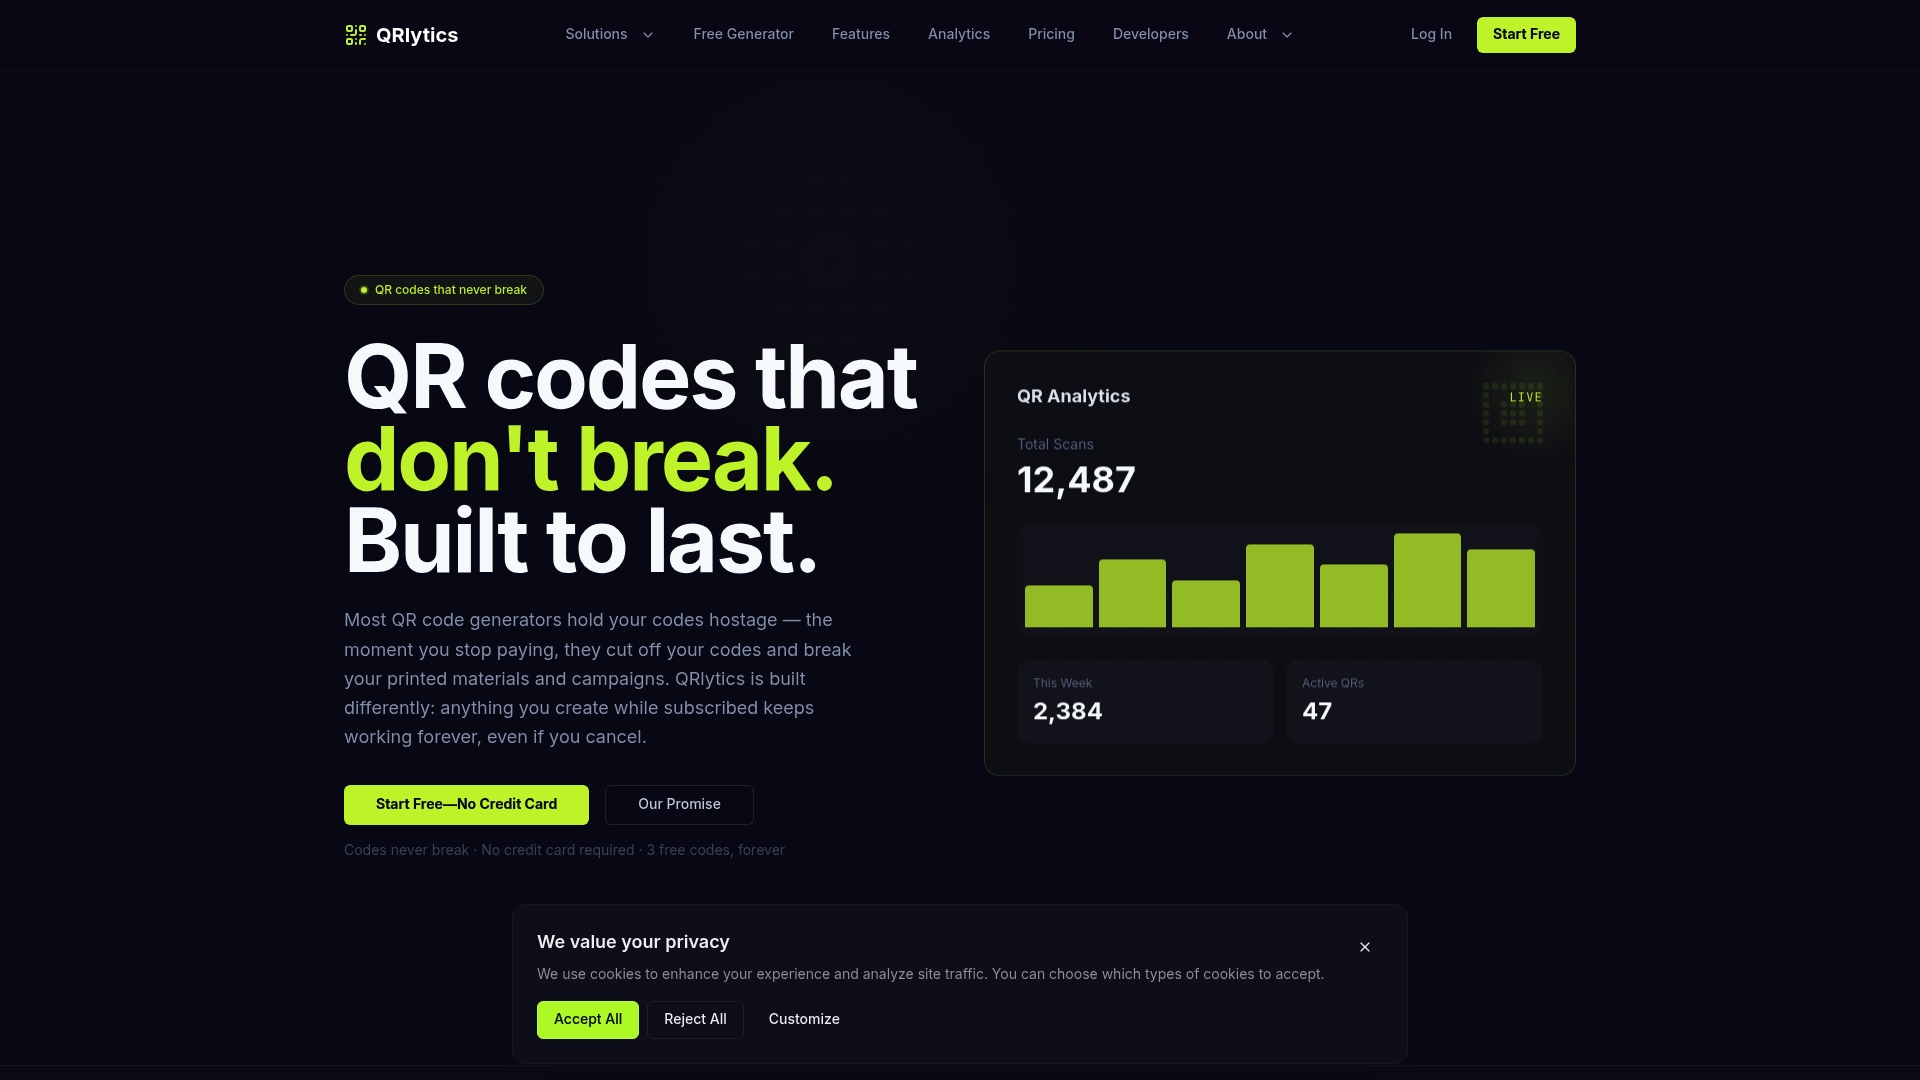
The platform fits three situations particularly well: packaging printed months ahead of launch, event series that reuse the same physical signage across multiple dates, and long-lived printed assets like shop window decals or business cards where a broken code means a costly reprint. Real-time scan analytics, GDPR-compliant location tracking, and CSV export mean the data feeds straight into the reporting structure covered above, without extra wiring.
Start with the free QR code generator to create and test a dynamic code with basic analytics, no credit card required. When you’re ready for full measurement control across a multi-placement campaign, the dynamic QR code generator gives you editable destinations and complete scan tracking from the first code onward.
Further resources for setting up QR measurement
For UTM naming conventions and cross-channel measurement, the Fast QR guide to tracking scans is a solid reference. For a deeper look at engagement tactics once traffic lands, the QR code engagement guide covers practical follow-through. For hands-on GA4 event wiring, see the digital engagement tracking workflow.
Sources
- How to measure QR code performance across print, events and packaging
- How to Track QR Code Scans (Without Guesswork) | Fast QR
FAQ
How do I track analytics from a QR code?
Use a dynamic QR code with a tracked redirect URL, append UTM parameters (especially utm_medium=qr), and register a conversion event in GA4 or your analytics platform to measure scan-to-conversion rate.
How do I analyse QR code data properly?
Separate exposure metrics (total scans, unique scans, device, location) from outcome metrics (landing-page sessions, conversions), and always reconcile the two rather than reporting scans in isolation.
What is the FBI warning about QR codes?
Security agencies have warned that malicious QR codes can redirect users to phishing sites or malware downloads, particularly when codes are placed over legitimate ones in public locations; always verify a code’s destination before scanning unfamiliar ones in the wild.
Can I track how many people actually use a QR code?
Yes. Dynamic QR code platforms report total scans, unique scans, device, location, and time period, giving you a reliable estimate of genuine usage rather than just a raw count. Static codes offer no such tracking once printed.
Why do my scan counts not match my website sessions?
A gap of roughly 5 to 15 percent is typical, caused by camera link previews, screenshot sharing, and redirect chains dropping parameters; a wider gap usually signals a broken or misconfigured redirect rather than genuine audience drop-off.