Why offline ads need digital feedback to perform
Offline ads cannot be optimised, attributed, or confidently scaled without digital feedback. A poster, a flyer, or a radio spot creates awareness, but without a measurable signal tied to that exposure, you are making budget decisions on instinct rather than data. The most reliable methods for capturing that signal are:
- Dynamic QR codes with UTM-tagged landing pages (scan-level data, device context, near-instant results)
- Vanity or short URLs with UTM parameters (low friction, works across print and broadcast)
- Unique promo codes per channel or creative variant (deterministic, revenue-linked)
- Dedicated phone numbers or call-tracking lines (useful for radio, direct mail, and local press)
- Geo or time-based lift tests (no creative change needed; measures aggregate uplift across a region or period)
Each method sits on a spectrum. QR codes and promo codes give you deterministic signals: you know exactly which ad drove the action. Geo lift tests give you probabilistic estimates: you infer causality from a controlled comparison rather than a direct identifier. For most pilots, combining at least two methods, one deterministic and one probabilistic, produces a decision-grade baseline you can defend to stakeholders.
Key takeaways
Offline ads without digital feedback are unoptimisable: you cannot improve what you cannot measure, and the methods to add measurement are available, affordable, and deployable within a week.
| Point | Details |
|---|---|
| Deterministic vs probabilistic | QR codes and promo codes give you confirmed actions; geo lift tests give you modelled estimates. Use both and report them separately. |
| Fastest pilot approach | A dynamic QR code with UTM tags, a dedicated landing page, a unique promo code, and a tracking sheet is the minimum viable measurement setup. |
| Creative execution matters | QR code sizing, contrast, CTA clarity, and landing-page message match directly affect scan and conversion rates. |
| Privacy from day one | UK GDPR and PECR apply to scan data and landing-page analytics. Configure consent banners and IP anonymisation before launch, not after. |
| Qrlytics for permanence | Qrlytics provides dynamic QR codes with permanent redirect guarantees, real-time analytics, and GDPR-considerate tracking for offline campaigns. |
Table of Contents
- Why offline advertising still matters for modern brands
- What ‘digital feedback’ from offline ads actually means
- Practical ways to add digital feedback to offline ads
- QR codes are often the fastest path to digital feedback
- How to measure effectiveness and attribute conversions to offline activity
- Designing offline creative so it generates useful digital signals
- Privacy and compliance checklist for the United Kingdom
- Typical costs, timelines and what to expect from a first pilot
- Worked example: a QR-led poster campaign from setup to reporting
- Quick checklist: how to get started this week
- When digital feedback changes the campaign brief
- Qrlytics gives you permanent, trackable QR codes for offline campaigns
- Sources
- FAQ
Why offline advertising still matters for modern brands
Offline advertising reaches people that digital channels routinely miss. A commuter on the London Underground is not scrolling Instagram; a shopper in a supermarket aisle is not reading a sponsored post. Physical formats, from out-of-home (OOH) posters to direct mail, occupy moments of undivided attention that are increasingly scarce online.
The business case is supported by adoption trends. PostGrid’s State of Offline Communication Report (2025), which surveyed 325 companies, found rising adoption of automation and personalisation in offline communications alongside measurable uplifts in recall and engagement. Brands are not retreating from physical channels; they are making them smarter.
Offline and digital serve different moments in the customer journey. Offline formats excel at awareness and trust building: a well-placed billboard or a quality direct mail piece signals investment and permanence in a way a banner ad rarely does. Digital channels are better at capturing intent and converting it. The problem is that most brands treat these as separate budgets with separate accountability. They are not. A consumer who sees your poster on Monday and searches your brand name on Thursday is a single journey, and integrating offline and online marketing is how you track it as one.
Consider a practical example. A regional food brand runs a 48-sheet poster campaign across Manchester. Two weeks later, branded search volume in that region rises noticeably. Without a tracking mechanism on the poster, the brand cannot confirm the poster caused the lift. With a QR code and a vanity URL, they can measure direct responses and cross-reference them with the search data to build a coherent attribution story. That is the gap digital feedback closes.
What ‘digital feedback’ from offline ads actually means
Digital feedback, in the context of offline advertising, refers to any measurable digital signal that can be traced back to a physical ad exposure. The industry term for the broader practice is offline-to-online attribution, and the signals it relies on fall into two categories.
Deterministic signals are direct identifiers: a QR code scan, a vanity URL visit, a promo code redemption, or a call to a dedicated tracking number. Each of these ties a specific action to a specific ad with high confidence. You know the person interacted with that creative, in that location, at that time.
Probabilistic signals are inferred: a rise in branded search queries in a region where you ran OOH, a sales uplift in a geo test market compared with a control market, or a time-series spike in web traffic that correlates with a campaign flight. These signals cannot be tied to an individual, but they can demonstrate aggregate campaign effect with statistical confidence when designed properly.
What counts as a valid signal for optimisation? The test is whether the signal is specific enough to inform a decision. A meta-analysis on digitally delivered feedback published in 2024 found that effectiveness depends heavily on context, content, and task factors, a principle that applies directly to marketing feedback loops: the signal is only as useful as the decision it informs.
Practical ways to add digital feedback to offline ads
Offline marketing tracking works best as a multi-identifier system.
-
Dynamic QR codes. Pros: scan-level data, device type, timestamp, location; easy to update the destination URL after print. Cons: requires a smartphone and a deliberate action from the viewer; scan rates vary significantly by placement and audience context. Best for: posters, direct mail, event materials, packaging.
-
Vanity or short URLs with UTM tags. Pros: works across print and broadcast; easy to type; UTM parameters feed directly into Google Analytics or your analytics platform. Cons: typed URLs introduce transcription errors; no scan-level data. Best for: radio, press ads, billboards where QR placement is impractical.
-
Unique promo codes per creative variant. Pros: deterministic and revenue-linked; no technology barrier for the consumer. Cons: codes can be shared beyond the intended audience, inflating apparent reach. Best for: direct mail, retail inserts, event handouts.
-
Dedicated phone numbers and call tracking. Pros: captures high-intent leads; call recordings add qualitative insight. Cons: higher setup cost; declining call volumes in younger demographics. Best for: local press, radio, direct mail targeting older audiences.
-
DOOH platform analytics. Pros: some digital out-of-home networks provide impression data, dwell time, and audience composition. Cons: data is aggregated and modelled, not individual-level. Best for: large-format OOH campaigns where direct response is secondary to reach measurement.
-
Event scan-ins and registration. Pros: captures named leads with consent; ties offline attendance to digital follow-up. Cons: limited to event contexts. Best for: trade shows, experiential activations, in-store events.
-
Geo and time-based lift tests. Pros: no creative change required; measures aggregate uplift across a region or time window. Cons: requires a control group and sufficient scale to detect a signal; results take weeks. Best for: TV, radio, large OOH campaigns where direct response is not feasible.
Hybrid attribution tactics, combining vanity URLs, rotating phone numbers, and promo codes alongside probabilistic geo lift, give you both a deterministic floor and a modelled upper bound. Report both figures separately rather than blending them into a single number that obscures the uncertainty.
Pro Tip: Assign each tracking asset (QR destination URL, promo code, phone number) to a named owner before launch. Broken redirects and mismatched UTMs are the most common causes of offline measurement failure, and they are almost always preventable with a simple pre-launch QA sheet.
QR codes are often the fastest path to digital feedback
QR codes have become the default first step for most offline-to-digital tracking pilots, and for good reason. They require no manual data entry from the consumer, they work on every modern smartphone, and they produce scan-level data that is available in near real time. UK smartphone penetration is high and growing, meaning the vast majority of your offline audience can complete a mobile handoff when prompted.
How the tracking works: when a consumer scans a dynamic QR code, the code resolves to a redirect URL. That redirect captures the timestamp, device type, and approximate location before forwarding the user to the destination page. If the destination URL carries UTM parameters (source, medium, campaign, content), your analytics platform records the session as a distinct traffic source. You can then measure landing-page visits, time on page, form completions, and purchases, all attributed to that specific QR code.
The practical value of dynamic codes, as opposed to static ones, is that you can update the destination URL after the materials have been printed. If your campaign landing page changes, or if you want to A/B test two different destinations, you do not need to reprint. This is particularly important for long-run print formats like catalogues, packaging, and permanent signage.
Operational best practices before you print:
- Minimum QR code size: 2.5 cm × 2.5 cm for standard viewing distances; larger for OOH formats
- High contrast between the code and its background (dark module on light background is most reliable)
- Test the code on at least three different devices and operating systems before sending to print
- Confirm the redirect resolves correctly and the UTM parameters appear in your analytics platform
- Check landing-page load speed on a mobile connection; pages that take more than three seconds to load lose a significant proportion of visitors
The QR redirect mechanics matter as much as the creative. A code that scans correctly but lands on a slow or mismatched page wastes the attention you paid to generate.
Research into immediate digital feedback systems, including the ExamVis study on digital score reports, shows that personalised, real-time feedback increases engagement and uptake. The same principle applies here: a landing page that immediately confirms relevance (matching the ad’s message and offer) converts at a higher rate than a generic homepage.
Qrlytics offers dynamic QR code generation with real-time scan analytics, GDPR-considerate tracking, and a permanent-code guarantee: codes created during an active subscription remain functional regardless of billing status, which matters for long-run print formats. The platform also provides global scan heatmaps, CSV export, and the ability to update redirect URLs without reprinting. You can explore the QR codes for marketing feature set to see how it fits a campaign tracking workflow.
How to measure effectiveness and attribute conversions to offline activity
Attribution for offline ads works on a hierarchy of confidence. Direct-response methods sit at the top; modelled lift estimates sit at the bottom. A sound measurement plan uses both and reports them separately.
Step 1: Direct response (deterministic floor). Count scans, vanity URL visits, promo-code redemptions, and inbound calls from dedicated numbers. These are your minimum confirmed interactions. They undercount total impact (most people who see an ad do not scan or call), but they are defensible and actionable.
Step 2: Short-window attribution. For campaigns with a clear flight window, compare web traffic, branded search volume, and conversion rates in the two weeks before, during, and after the campaign. A consistent uplift during the flight that returns to baseline afterwards is a strong signal, though not proof of causality on its own.
Step 3: Geo or matched-market lift tests. Select comparable regions: one exposed to the campaign, one not. Measure the difference in your target metric (sales, web visits, store footfall) between the two groups over the campaign period. This is the most rigorous offline measurement method available without individual-level tracking. It requires sufficient scale and a well-matched control group to produce reliable results.
Step 4: Time-series modelling. For always-on or long-running campaigns, use historical data to build a baseline forecast and measure actual performance against it. Deviations that correlate with campaign activity are attributed to the campaign. This is a probabilistic method and should be labelled as such in reporting.
For offline-to-online attribution to produce decision-grade data, you need a clear measurement model agreed before launch, not retrofitted afterwards.
| Method | Accuracy | Cost | Scale | Typical use case |
|---|---|---|---|---|
| QR / vanity URL / promo code | High (deterministic) | Low | Any | Print, direct mail, events |
| Dedicated phone / call tracking | High (deterministic) | Medium | Any | Radio, local press, direct mail |
| Short-window attribution | Medium (correlational) | Low | Any | Campaigns with clear flight dates |
| Geo lift test | Medium-High (causal) | Medium | Regional+ | OOH, TV, radio |
| Time-series modelling | Medium (probabilistic) | Medium | National | Always-on or long-running campaigns |
These are indicative ranges drawn from practitioner experience, not guaranteed outcomes; your category, creative quality, and audience will all affect results.
Analytics in marketing consistently shows that campaigns with structured measurement frameworks outperform those without, because feedback enables iteration rather than repetition.
Designing offline creative so it generates useful digital signals
The creative execution determines whether your tracking infrastructure actually gets used. A QR code buried in the corner of a busy poster at 1.5 cm will not be scanned. A vanity URL printed in a light grey font on a white background will not be typed. The design decisions are as important as the measurement model.
Creative checklist for measurable offline ads:
- Single dominant CTA. One action per ad. If you want a scan, make the QR code the visual anchor. If you want a URL visit, make the URL the most prominent text element after the headline.
- QR code sizing and contrast. Minimum 2.5 cm × 2.5 cm for A4 or smaller formats; scale up proportionally for larger formats. Dark modules on a white or very light background. Avoid placing the code over a photographic background.
- Matching messaging. The headline on the ad and the headline on the landing page should be near-identical. A mismatch between what the ad promises and what the page delivers increases bounce rates and corrupts your conversion data.
- Mobile-first landing page. The page must load in under three seconds on a 4G connection. Use a single-column layout, a clear headline, and one form or CTA above the fold.
- Readable vanity URL. Keep it short (under 20 characters), avoid hyphens where possible, and use a memorable word rather than a random string. Print it in a font size that is readable at the expected viewing distance.
- Version control. If you are running multiple creative variants, each must have its own QR code or URL with a distinct UTM content parameter. Mixing variants under a single tracking URL makes creative testing impossible.
Dos and don’ts:
- Do: test the QR code on the actual printed proof, not just the digital file
- Do: include a brief instruction (“Scan to claim your offer”) near the code; it increases scan rates
- Don’t: use a static QR code for any format with a print run over a few hundred copies
- Don’t: send traffic to your homepage; always use a dedicated, campaign-specific landing page
For designers, pre-print QA checks for QR placement and contrast are worth building into the standard sign-off process. A redirect error discovered after 10,000 leaflets have been distributed is an expensive lesson.
Privacy and compliance checklist for the United Kingdom
Collecting digital feedback from offline ads involves processing personal data in ways that UK GDPR and the Privacy and Electronic Communications Regulations (PECR) govern directly. Getting this right from the start protects your organisation and builds trust with your audience.
What constitutes personal data in this context. An IP address captured during a QR scan is personal data under UK GDPR. A phone number captured via a call-tracking line is personal data. A name and email address collected via a landing-page form is personal data. Aggregate scan counts with no individual identifiers are not personal data, but most analytics platforms collect more than that by default.
Lawful basis for analytics tracking. For cookie-based analytics on a landing page reached via a QR scan, you need a valid lawful basis under UK GDPR and compliance with PECR. Consent is the most straightforward basis for non-essential analytics cookies. Your landing page must display a cookie consent banner before any non-essential tracking fires. The ICO’s guidance on cookies and similar technologies is the authoritative reference for UK-based campaigns.
Collecting contact data via landing pages or SMS. If your landing page collects email addresses or phone numbers, you need explicit consent for marketing communications under PECR. Pre-ticked boxes are not valid. The consent must be specific, informed, and freely given. Retain a record of when and how consent was obtained.
Practical mitigations:
- Configure your analytics platform to anonymise IP addresses at collection
- Set data retention periods in your analytics tool to the minimum needed for campaign analysis (90 days is a common default; review whether you need longer)
- Include a clear link to your privacy notice on every campaign landing page
- For SMS or email follow-up from event scan-ins, confirm opt-in at the point of data collection, not retrospectively
- If you use call-tracking numbers, inform callers that calls may be recorded (a brief recorded message at the start of the call satisfies this requirement)
Typical costs, timelines and what to expect from a first pilot
A first pilot does not need to be expensive. The goal is to establish a measurement baseline, not to prove the channel at scale. Here is a realistic cost breakdown for a QR-led print campaign pilot in the UK.
Typical cost components:
- Creative and design: £500–£2,000 depending on whether you use an agency or in-house resource
- Print and distribution (e.g. 5,000 A5 flyers): £300–£800
- QR code management and analytics platform: £0–£50/month depending on the tool and tier
- Dedicated landing page build: £200–£1,000 (or £0 if you use an existing CMS with a new page)
- Analytics setup and UTM configuration: typically in-house, 2–4 hours
- Geo lift test resource (if applicable): 4–8 hours of analyst time
Total pilot budget: £1,000–£4,000 is a reasonable range for a small, well-instrumented test. The measurement infrastructure (QR platform, analytics, landing page) is reusable across future campaigns, so the marginal cost of subsequent pilots falls significantly.
Sample pilot timeline:
- Week 1 (planning): Define objective, select measurement model, agree KPIs, assign tracking asset owners, set up analytics
- Weeks 2–3 (build and QA): Create QR codes and vanity URLs, build landing page, configure UTM parameters, run pre-launch QA on all redirects and tracking
- Week 4 (deploy): Distribute materials, confirm distribution (geo-validate where possible), activate campaign
- Weeks 5–8 (monitor and measure): Track daily scans, landing-page visits, and promo redemptions; run geo or time-series lift analysis in week 8
If your pilot falls below these ranges, the most common causes are poor QR placement, a mismatched landing page, or a weak offer, all of which are fixable before you scale.
Worked example: a QR-led poster campaign from setup to reporting
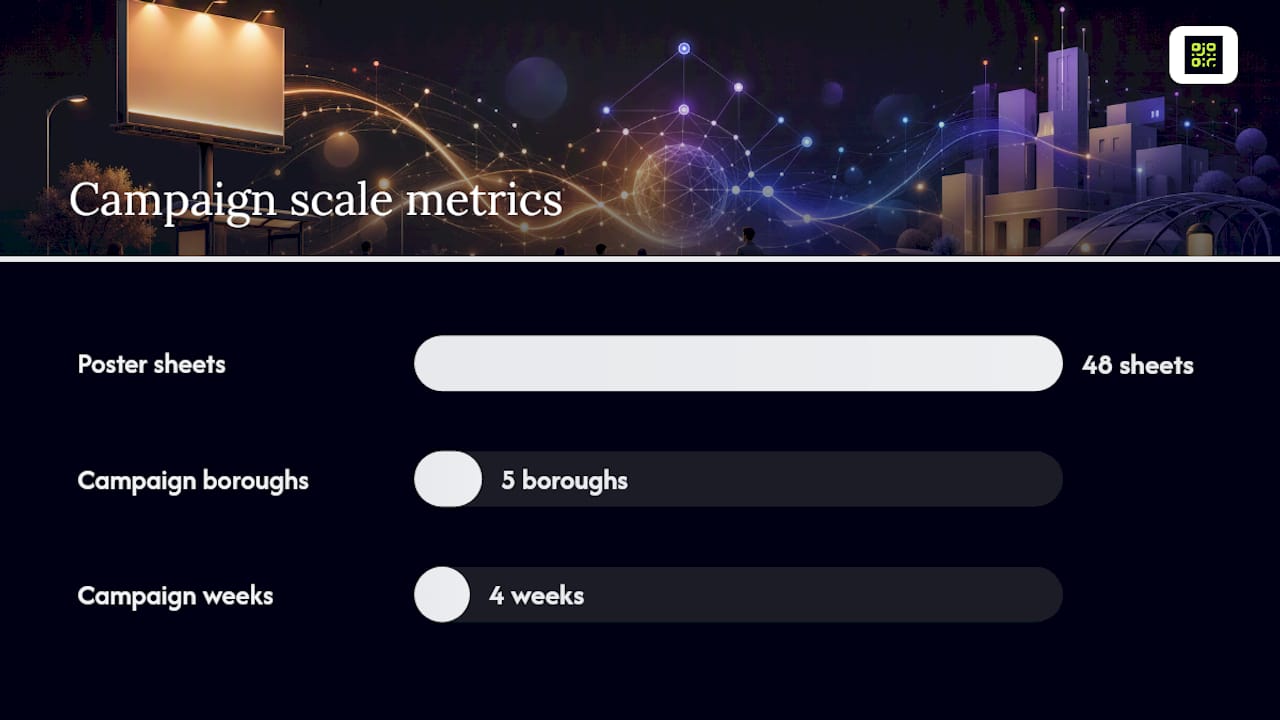
Objective: Drive trial sign-ups for a subscription product via a 48-sheet OOH campaign across five London boroughs over four weeks.
Measurement model: Direct response (QR scans + landing-page conversions) as the deterministic floor; branded search volume uplift in the campaign boroughs versus a matched control group as the probabilistic upper bound.
Campaign setup:
- Create five dynamic QR codes in Qrlytics, one per borough, each redirecting to a dedicated landing page with UTM parameters:
utm_source=ooh&utm_medium=poster&utm_campaign=trial-q3&utm_content=borough-name - Build a single landing page with a clear headline matching the poster copy, a brief product description, and a sign-up form. Include a unique promo code per borough (e.g.
NORTH25,EAST25) pre-populated in the form to reduce friction - Configure Google Analytics 4 to track form completions as a conversion event, with the UTM parameters passing through correctly
- Set up a tracking sheet (a shared spreadsheet) with columns for: borough, QR code ID, weekly scans, landing-page visits, form completions, promo-code redemptions, and notes
Tracking and analysis (weeks 5–8):
- Pull weekly scan data from the QR analytics platform and cross-reference with GA4 session data. A significant gap between scans and sessions indicates a redirect or UTM issue; investigate immediately
- At week 8, compare branded search volume (via Google Search Console or a search analytics tool) in the five campaign boroughs against the matched control boroughs for the same four-week period
- Report the deterministic floor (confirmed sign-ups from QR + promo code) and the probabilistic estimate (branded search uplift) separately. Do not blend them into a single “total attributed” figure
Dashboard elements to report to stakeholders:
- Total scans by borough (bar chart)
- Scan-to-visit rate and visit-to-conversion rate (funnel)
- Promo-code redemptions by code (table)
- Branded search volume: campaign boroughs vs. control (line chart)
- Cost per confirmed sign-up (deterministic) and estimated cost per influenced sign-up (probabilistic, labelled as modelled)
Operational tips. Photograph the installed posters in each borough on day one of the campaign. This serves as proof of distribution and allows you to verify QR code placement and visibility. Keep the tracking sheet updated weekly; a gap in the data is much harder to reconstruct after the campaign ends than to maintain in real time. Assign one person as the tracking owner: they are responsible for the weekly data pull, the QA check, and flagging anomalies.
A multi-identifier tracking plan combining QR codes, promo codes, and a geo lift comparison is the recommended approach for decision-grade offline measurement, and the operational QA steps above are what prevent the most common measurement failures.
Quick checklist: how to get started this week
Immediate tasks (this week):
- Pick your measurement model: deterministic (QR + promo code), probabilistic (geo lift), or both
- Create a dynamic QR code with a UTM-tagged destination URL; do not use a static code for any printed format
- Build or designate a campaign-specific landing page (not your homepage)
- Set up conversion tracking in your analytics platform and confirm UTM parameters are passing through
- Create a tracking sheet with named owners for each asset
- Run a pre-launch QA: scan the code on three devices, confirm the redirect, check the UTM in analytics, load the landing page on a mobile connection
60-day action plan:
- Week 1: Planning, measurement model selection, KPI agreement, asset ownership assignment
- Weeks 2–3: Build QR codes, landing page, and tracking infrastructure; run full QA
- Week 4: Deploy campaign; photograph distribution; confirm tracking is live
- Weeks 5–8: Monitor weekly; run geo or time-series lift analysis; prepare stakeholder report
For practical guidance on boosting QR scan rates and reducing friction in the offline-to-online handoff, the tactical details matter as much as the strategy.
When digital feedback changes the campaign brief
The most underappreciated consequence of adding measurement to offline ads is what it does to the brief. When you know a campaign will be measured, the brief stops being “reach as many people as possible” and starts being “reach the right people and give them a reason to take a specific action.” That is a fundamentally different creative and media-planning conversation.
Feedback data changes decisions mid-flight, not just in retrospect. If week-two scan data shows that borough A is generating three times the scan rate of borough B with identical creative, you have a media-planning signal: reallocate budget or increase frequency in borough A. Without that data, you would wait until the campaign ends and make the same guess you made at the start.
The harder change is organisational. Getting procurement and creative teams to treat tracking assets (QR codes, vanity domains, UTM sheets) as campaign deliverables with owners and sign-off steps requires a shift in how campaigns are briefed and approved. The practical tip: add tracking asset ownership to the campaign brief template itself, alongside creative deliverables and media placements. When it appears on the same document as the poster artwork, it gets the same attention. When it is an afterthought, it gets broken redirects and missing UTMs.
Offline campaigns that use data to drive growth are not just better measured; they are briefed differently from the start, and that upstream change is where the real performance gain comes from.
Qrlytics gives you permanent, trackable QR codes for offline campaigns
Offline campaigns with QR codes live and die on one thing: whether the code still works six months after the materials were printed. Qrlytics solves that directly. Codes created during an active subscription remain functional permanently, regardless of billing status, so a poster, a catalogue, or a packaging run does not become a liability the moment a payment lapses.
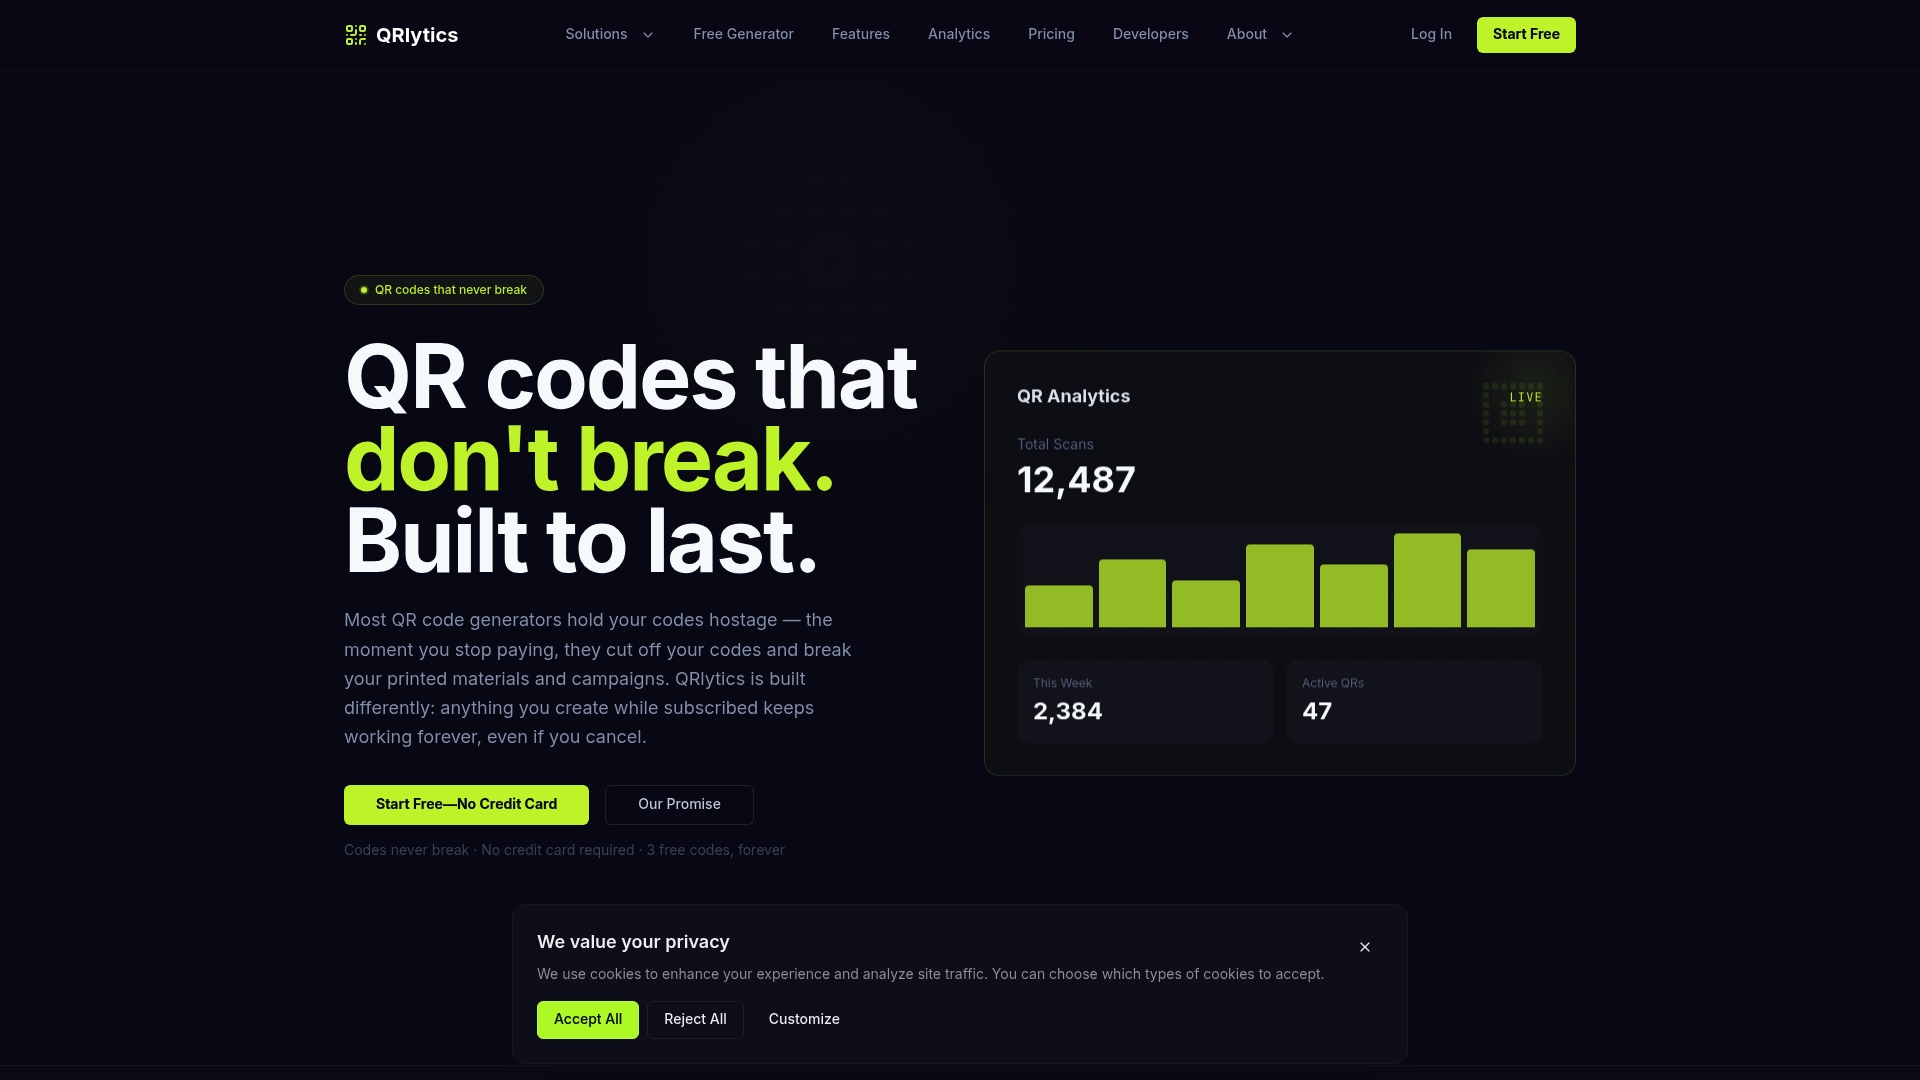
Beyond permanence, Qrlytics gives you the analytics infrastructure a measurement-minded campaign actually needs: real-time scan data, device and location context, global heatmaps, CSV export for stakeholder reporting, and GDPR-considerate tracking built in from the start. Dynamic redirects mean you can update the destination URL after print without touching the code. UTM parameters pass through cleanly to your existing analytics platform.
For a first pilot, you can generate a free dynamic QR code with basic analytics at no cost and no credit card required. If you need full scan analytics, heatmaps, and multi-code campaign management, the dynamic QR code generator with analytics gives you everything in one place. Start with a single code on a test print run, confirm the tracking works end-to-end, and scale from there.
Sources
- InfluencerDB – Offline marketing tracking: Measure ROI that matters
- PostGrid — State of Offline Communication Report (2025)
- Frontiers in Education — ExamVis study on digital score reports (2019)
- Springer — meta-analysis on digitally delivered instructional feedback (2024)
FAQ
Why is offline advertising still important for brands?
Offline advertising reaches audiences in moments of undivided attention that digital channels rarely access, and it builds brand trust through physical presence and perceived investment. When combined with digital tracking, it becomes measurable and optimisable rather than a pure awareness spend.
What are the main benefits of offline campaigns compared with digital-only activity?
Offline formats offer longer shelf life, higher recall in certain contexts, and access to audiences who are not reachable through digital channels alone. Direct mail, in particular, tends to generate higher engagement rates than email for equivalent offers, and physical formats are not subject to ad-blocking.
How can you measure the impact of an offline ad digitally?
The most reliable methods are dynamic QR codes with UTM-tagged landing pages, unique promo codes per creative variant, and dedicated phone numbers for call tracking. For aggregate campaign effect, geo lift tests comparing exposed and control regions provide a causal estimate without individual-level tracking.
How does digital marketing work alongside offline channels?
Offline ads generate awareness and prompt intent; digital channels capture and convert that intent. A consumer who sees a poster and later searches the brand name is completing a journey that started offline. Tracking tools like QR codes and vanity URLs make that handoff measurable by connecting the physical touchpoint to a specific digital session.
What does UK GDPR require for tracking offline ad responses?
IP addresses captured during QR scans and contact data collected via landing pages are personal data under UK GDPR. You need a valid lawful basis (typically consent for non-essential analytics cookies) and must display a cookie consent banner before non-essential tracking fires. The ICO is the authoritative source for UK-specific compliance guidance.