QR scan time-of-day data: what marketers need to know
QR scan time-of-day data is the timestamped record of when individual QR scans occur, and it turns raw scan counts into timing signals you can use to schedule, staff, and optimise campaigns. Every time someone scans a dynamic QR code, the platform records the exact moment as a UTC timestamp, which is then converted to local time for reporting. That single data point, multiplied across hundreds or thousands of scans, reveals when your audience is most engaged and most likely to convert.
Three immediate uses stand out:
- Scheduling signage updates: if your poster at a rail station peaks between 07:30 and 09:00, you can time a creative swap or a limited-time offer to land precisely in that window.
- Staffing and event planning: scan spikes during a conference lunch break tell you when to open a demo station or send a follow-up SMS.
- Timing follow-up communications: post-scan email or push sequences triggered within the observed peak window consistently reach audiences while intent is still fresh.
Platforms such as Qrlytics record these timestamps in real time and present them as hourly distributions, day-of-week heatmaps, and rolling averages. Under UK GDPR, timestamp data is handled as analytics metadata, but consent and minimisation obligations still apply, as covered later in this guide.
Key takeaways
Time-of-day scan data is only as useful as the quality of the dynamic codes, timezone handling, and data-cleaning steps behind it.
| Point | Details |
|---|---|
| Use dynamic codes only | Static QR codes produce no server-side timestamps; switch to dynamic before any tracked campaign. |
| Standardise to UK local time | Convert all UTC timestamps to GMT or BST before analysis to avoid one-hour errors in your hourly buckets. |
| Focus on conversion rate by cohort | The highest-volume hour is rarely the highest-converting one; optimise spend around cohort conversion rates. |
| Schedule creative around observed peaks | Midday and early evening periods are consistent weekday peaks for most placements. |
| Apply data-cleaning before analysis | Deduplicate by session window, filter bot scans, and tag time-limited campaigns with start and end dates. |
Table of Contents
- Why static vs dynamic QR codes determine whether you get timing data
- What exactly is QR scan time-of-day data, and how is it stored?
- Typical scan patterns by placement and campaign context
- How to collect and prepare time-of-day scan data correctly
- Which metrics and visualisations actually reveal timing signals?
- How to turn timing insights into campaign decisions
- What time-of-day data cannot tell you, and UK GDPR considerations
- A step-by-step time-of-day analysis using Qrlytics
- The timing signal most marketers are still ignoring
- Try time-of-day tracking with Qrlytics
- Sources
- FAQ
Why static vs dynamic QR codes determine whether you get timing data
The distinction between static and dynamic QR codes is the single most important technical decision for anyone who wants time-of-day analytics.
A static QR code encodes the destination URL directly into the code’s pixel pattern. When someone scans it, their device reads the URL and opens it without any intermediary server. No redirect happens, so no scan event is logged, and no timestamp is recorded. You get nothing beyond whatever your landing page’s own analytics captures.
A dynamic QR code works differently. The code encodes a short redirect URL hosted on the platform’s servers. Every scan passes through that server, which logs the event, records the UTC timestamp, captures device metadata, and then forwards the user to the destination. That server-side intercept is what makes per-scan timestamps possible.
The practical consequences go further than just tracking. With dynamic codes, you can change the destination URL without reprinting, apply campaign tags, and schedule time-limited activations. Time-limited dynamic codes can be configured with timezone-aware start and end dates, so a code printed on a festival wristband activates on the event’s opening day and expires at midnight on the final day. That scheduling capability is only available because the redirect logic lives on the server, not inside the code itself.
Pro Tip: Never print static QR codes on materials you intend to measure. If the brief mentions analytics, the answer is always a dynamic code from the outset.
What exactly is QR scan time-of-day data, and how is it stored?
Time-based QR code performance analysis groups scans by hour, day, and season to reveal when engagement peaks and whether those peaks align with your intended promotional windows. The raw material for that analysis is a structured scan event record.
A typical scan event contains these core fields:
- Timestamp (ISO 8601 / UTC): the precise moment of the scan, e.g.
2025-11-14T08:42:17Z - Local hour: the UTC timestamp converted to the reporting timezone (GMT or BST for UK campaigns)
- Day of week: Monday through Sunday, derived from the local timestamp
- QR code ID: the unique identifier for the specific code scanned
- Campaign tag: an optional label you assign to group codes by campaign or placement
- Device type / user-agent: mobile OS and browser where the platform captures it
- Session ID: a pseudonymous identifier used to deduplicate rapid repeat scans
Platforms export these fields as CSV files with one row per scan event. A minimal export looks like this:
| Field | Example value |
|---|---|
scan_id |
a3f9c2 |
qr_id |
poster_victoria_01 |
timestamp_utc |
2025-11-14T08:42:17Z |
local_hour |
8 |
day_of_week |
Friday |
device |
iOS / Safari |
campaign_tag |
autumn_launch |
The timezone conversion step matters more than it sounds. The UK observes GMT in winter and BST (UTC+1) in summer. A scan at 2025-07-15T19:30:00Z is 20:30 BST locally, which shifts it from an “evening” bucket into a “late evening” one. Analytics endpoints commonly return a day_time array with hourly counts, and the best platforms let you specify the reporting timezone at export so you never have to adjust manually.
Typical scan patterns by placement and campaign context
Knowing what normal looks like for your placement type helps you spot anomalies and set realistic hypotheses before you have enough data of your own. Research into QR scan timing patterns identifies two consistent weekday peaks: midday (11:00–14:00) and early evening (17:00–20:00), with Tuesday through Thursday showing stronger engagement for professional or B2B placements.
Beyond those headline figures, patterns vary considerably by context:
- Transit and commuter posters: morning peaks between 07:30 and 09:00, with a secondary spike on the evening commute. Weekend volumes drop sharply.
- In-store shelf labels and retail displays: lunch and early afternoon (12:00–15:00) dominate, with Saturday outperforming weekdays in consumer retail.
- Event signage and conference materials: scans cluster around registration, breaks, and the first 20 minutes after sessions end. Evening networking events generate a distinct late-evening spike.
- Restaurant table cards and menus: lunch (12:00–14:00) and dinner (18:00–21:00) windows, with Friday and Saturday evenings consistently the highest-volume periods.
- Product packaging (post-purchase): scans often arrive 24–72 hours after purchase, skewing towards evenings and weekends when consumers unbox at home. This is one of the few placements where Sunday outperforms Monday.
These are directional benchmarks, not guarantees. A QR code on a gym locker-room poster will behave differently from one on a coffee-shop receipt, even if both fall loosely into “retail.” Use these patterns to form a hypothesis, then let your own data confirm or challenge it after two to three weeks of live tracking.
How to collect and prepare time-of-day scan data correctly
Clean data produces reliable timing signals. Skipping any of the steps below is the most common reason time-of-day analysis produces misleading peaks.
- Use dynamic QR codes. Confirm every code you intend to measure is dynamic before printing or publishing. Static codes produce no server-side scan events.
- Enable per-scan timestamp logging. Most platforms do this by default, but verify in your account settings that individual scan events are recorded rather than just daily totals.
- Store or export raw UTC timestamps. Aggregate reports that show only “scans today” discard the hour-level detail you need. Export the raw event log as CSV.
- Convert UTC to UK local time. Apply GMT in winter (October to March) and BST (UTC+1) in summer (late March to October). A single timezone error shifts every scan in your dataset by one hour.
- Deduplicate by session window. A user who scans the same code three times in 90 seconds is one engagement event, not three. Apply a session window (typically 30–90 seconds) and count only the first scan per session per code.
- Filter bot and automated scans. Exclude user-agents that match known crawlers and flag scan events where the device string is absent or generic. Analytics API responses often include a bot-exclusion flag you can filter on programmatically.
- Tag time-limited campaigns with start and end dates. When a code is only active for a defined window, record those boundaries in your dataset so you do not misread a drop-off as disengagement when it is simply expiry.
Pro Tip: Export your raw scan log weekly rather than relying on dashboard screenshots. A CSV with UTC timestamps gives you a permanent, reprocessable record you can re-analyse as your methodology improves.
Which metrics and visualisations actually reveal timing signals?
Tracking QR code scan data is most useful when you move beyond total scan counts and focus on time-segmented metrics. The ones that consistently surface actionable signals are:
- Scans by hour: the foundational view. Plot total scans on a 24-hour axis to identify your peak and trough windows.
- Unique scanners by hour: strips out repeat scans to show how many distinct people engaged in each hour bucket.
- Rolling 7-day average: smooths day-to-day noise so genuine trend shifts become visible. A time-based analysis guide recommends this as a starting metric alongside first-time versus repeat scan comparisons.
- Scan-to-conversion rate by time cohort: the most commercially useful metric. Divide conversions (form fills, purchases, downloads) by scans for each hour bucket. A cohort with half the scan volume but double the conversion rate deserves more creative investment than the raw-volume peak.
- Day-of-week heatmap: a grid of hours (rows) by days (columns) with colour intensity showing scan density. Heatmaps reveal patterns that line charts obscure, particularly for placements with complex weekly rhythms.
The trade-off between volume and conversion quality is where most campaigns go wrong. A midday spike on a transit poster might generate high scan counts from commuters who scan out of curiosity and bounce immediately. An evening spike from the same poster might be smaller but produce a higher proportion of completed actions. Chasing volume without checking conversion rates by cohort leads to misallocated spend.
How to turn timing insights into campaign decisions
Once you have clean, time-segmented data, the translation into operational decisions is straightforward. QR scan data analysis becomes most valuable when it connects to a specific action rather than sitting in a dashboard.
Practical steps to apply immediately:
- Retime promotions to peak windows. If your data shows a consistent 12:00–13:00 spike, schedule limited-time offers to activate at 11:45 and expire at 13:30.
- Swap creative by time cohort. Dynamic codes let you redirect to different landing pages at different hours. A morning commuter and an evening browser are in different mindsets; serve them different content.
- Schedule short-lived codes for events. Use timezone-aware start and end dates to activate codes only during the event itself, keeping post-event scans from polluting your campaign data.
- Align staffing with observed peaks. If your restaurant’s table QR codes spike between 18:30 and 19:30, that is when your team needs to be at full capacity to handle the resulting orders or enquiries.
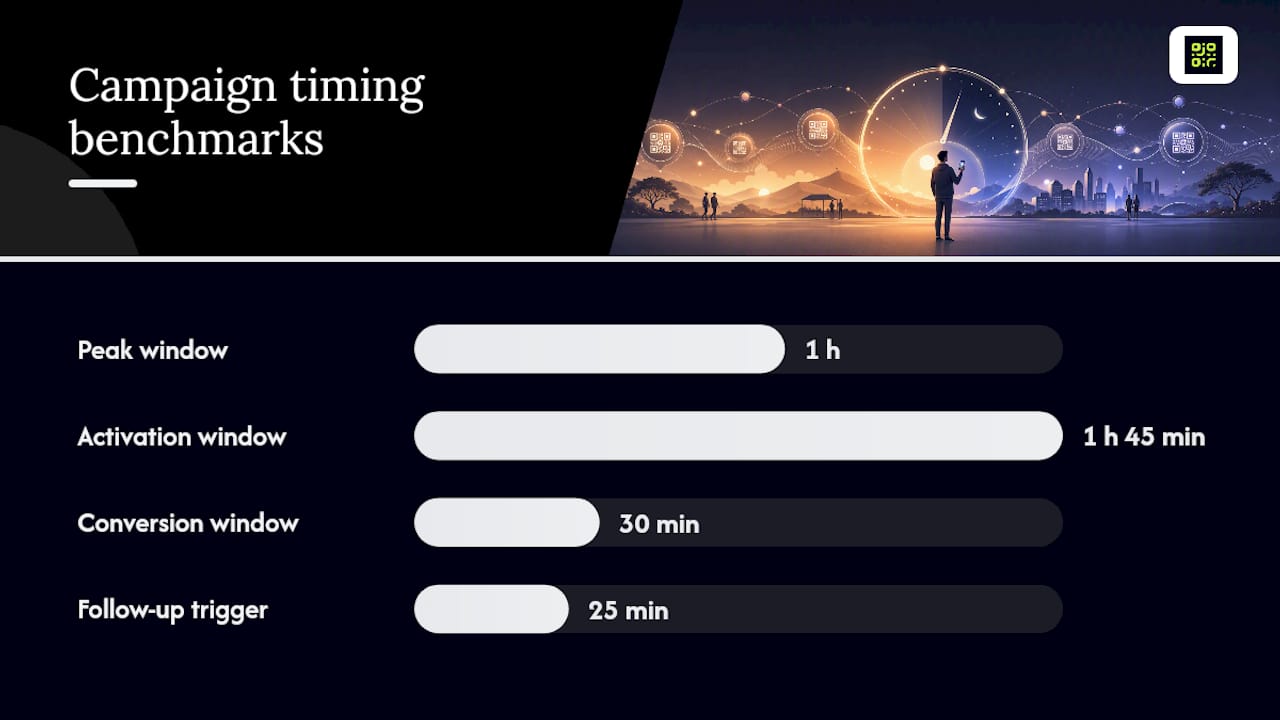
- Trigger follow-up within the post-scan window. If your data shows that most conversions happen within 30 minutes of a scan, an automated email triggered at the 25-minute mark will consistently outperform one sent the following morning.
- A/B test landing pages by hour to leverage audience targeting explained strategies for more effective segmentation. Run variant A during your morning peak and variant B during your evening peak for two weeks, then compare conversion rates. Time cohort testing is one of the fastest ways to improve campaign ROI, and analytics in marketing consistently links this kind of segmented measurement to stronger returns.
Pro Tip: Prioritise the time cohort with the highest conversion rate, not the highest scan volume. A smaller, higher-intent audience is almost always more valuable than a large, low-intent one.
What time-of-day data cannot tell you, and UK GDPR considerations
Timing data is a powerful signal, but it has clear limits. Knowing when someone scanned tells you nothing about why they scanned, what they did before arriving, or whether they were the person your campaign was designed to reach. A scan at 08:45 on a Tuesday could be a commuter, a delivery driver, or a curious passer-by.
Common analytical pitfalls to avoid:
- Misaligned timezones: a single GMT/BST error shifts your entire dataset by one hour and can make an evening peak look like a late-night anomaly.
- Over-interpreting small-sample peaks: a spike of 12 scans in a single hour is noise, not a pattern. Wait for at least two to three weeks of data before drawing conclusions.
- Bot and repeat-scanner noise: unfiltered data inflates certain hours, particularly overnight, where automated crawlers operate. Always apply bot exclusion before analysis.
- Confusing scan time with dwell time: a timestamp records when the scan happened, not how long the user spent on the landing page. Dwell and engagement data comes from your web analytics tool, not your QR platform.
Under UK GDPR, QR scan analytics fall under the same obligations as any other web analytics. Timestamps and device metadata are personal data when they can be linked to an identifiable individual. The lawful basis for analytics is typically legitimate interests, but you must document that assessment. Apply data minimisation: do not collect IP addresses unless you have a specific, documented purpose. Where you enrich scan data with CRM or conversion data, pseudonymise the link between scan events and individual profiles. For enriched or profiled tracking, a consent mechanism is the safest approach.
The trackable fields from QR scans that UK GDPR most directly affects are IP addresses and device identifiers. Most reputable platforms pseudonymise these by default, but confirm your provider’s data processing agreement covers UK GDPR specifically, not just EU GDPR, since the UK retained its own version of the regulation post-Brexit.
A step-by-step time-of-day analysis using Qrlytics
This workflow applies to a typical retail or event campaign. Adapt the time windows and conversion events to your context.
- Create dynamic QR codes in Qrlytics. Use the dynamic QR code generator to create your codes. Assign a campaign tag (e.g.
event_nov25) so you can filter by campaign at export. - Set timezone to UK local time. In your Qrlytics account settings, confirm the reporting timezone is set to London (GMT/BST). This ensures the dashboard’s hourly charts already reflect local time.
- Let the campaign run for at least 14 days. Fewer than two weeks of data makes day-of-week patterns unreliable. For events shorter than this, export raw UTC logs and analyse programmatically.
- Export the raw scan log as CSV. Download the full event log from the analytics section. Each row is one scan event with timestamp, QR ID, campaign tag, and device type.
- Convert UTC timestamps to UK local time. In a spreadsheet or Python script, apply the GMT/BST offset based on the scan date. Flag any scans that fall in the BST transition window (late March and late October) for manual review.
- Bucket scans by hour and day of week. Create a pivot table with hours (0–23) as rows and days (Monday–Sunday) as columns. Sum scans per cell to build your heatmap dataset.
- Compute rolling 7-day averages. For each hour bucket, calculate the average daily scan count over the preceding seven days. This smooths weekly spikes and reveals genuine trend shifts.
- Calculate scan-to-conversion rate by time cohort. Join your scan export with your conversion data (form submissions, purchases) using a session ID or UTM parameter. Divide conversions by scans for each hour bucket.
- Identify your top two or three converting cohorts. These are the windows where you concentrate creative spend, schedule promotions, and trigger follow-up communications.
- Act and re-measure. Change one variable (creative, offer timing, or landing page) for the next campaign cycle and compare cohort conversion rates against your baseline.
Pro Tip: Use Qrlytics’s global scan heatmap to spot geographic clusters alongside timing data. A concentration of evening scans from a specific city might justify a localised follow-up campaign rather than a national one.
The timing signal most marketers are still ignoring
Most QR analytics conversations focus on total scan counts and geographic heatmaps. Timing data gets treated as a secondary metric, something to glance at rather than act on. That is a missed opportunity, and the gap between teams who use it well and those who do not is widening.

The conventional advice is to “post at peak times,” which is generic enough to be useless. What time-of-day scan data actually gives you is something more specific: evidence that your particular audience, in your particular placement context, behaves differently from the published benchmarks. A midday spike on a transit poster in Manchester may look nothing like one in central London. An evening peak for a restaurant in Edinburgh may skew later than the national average suggests. Your data is the benchmark that matters.
The other thing most guides understate is the conversion quality gap between time cohorts. Volume peaks are visible and satisfying to report. Conversion rate by cohort requires an extra join between your scan export and your conversion data, and most teams skip it because it takes 20 minutes longer. Acting on that finding changes where you concentrate creative spend, when you trigger follow-up sequences, and how you staff around campaign windows.
Start with the conversion rate by cohort. Everything else follows from that.
Try time-of-day tracking with Qrlytics
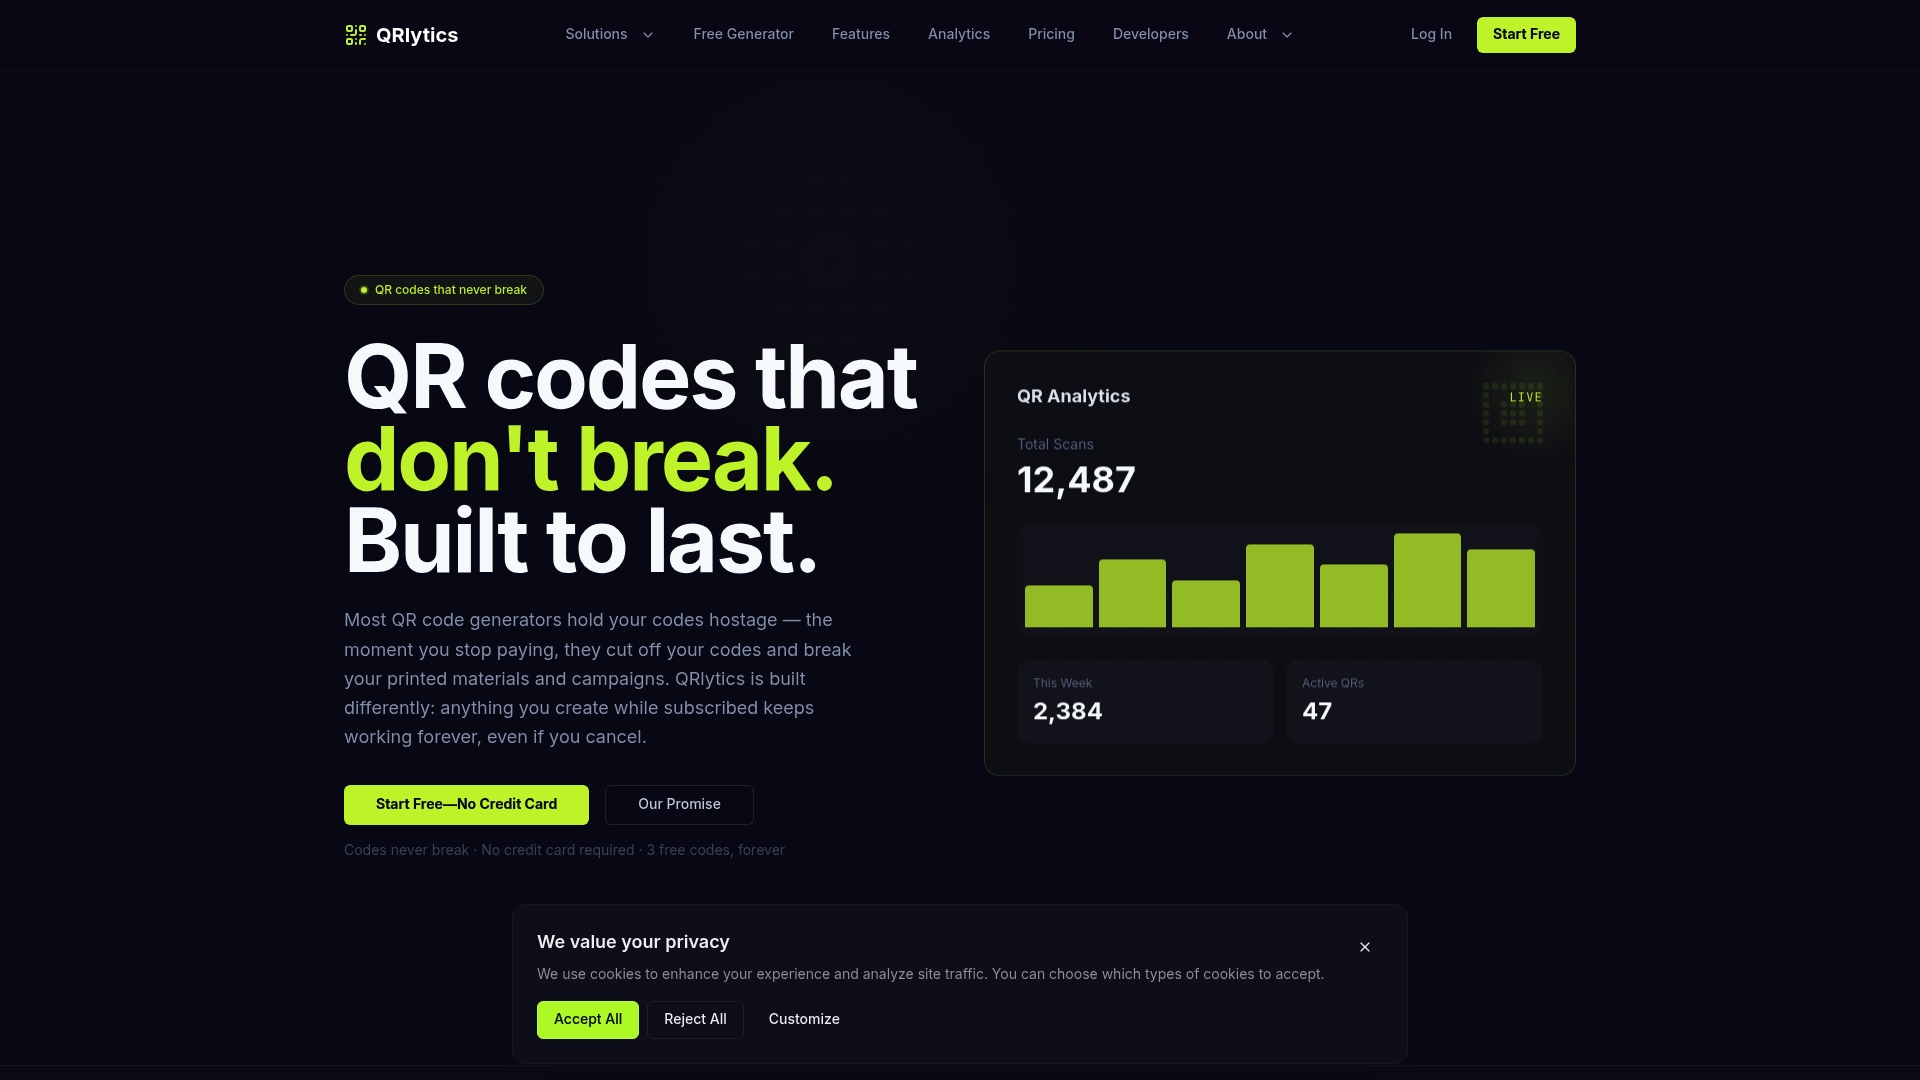
Qrlytics records a timestamped scan event for every scan, converts it to your reporting timezone, and presents it as hourly distributions, day-of-week heatmaps, and rolling averages, all within a GDPR-compliant platform. Dynamic codes created during an active subscription remain functional permanently, so your printed materials never become dead links.
Start tracking scan timing free with no credit card required, or explore the full analytics feature set to see how hourly distributions and heatmaps work in practice.
Sources
These resources support the methods described in this guide and point to implementation-level detail for teams building or extending their QR analytics setup.
FAQ
What is QR scan time-of-day data?
QR scan time-of-day data is the timestamped record of when each individual scan occurs, stored as a UTC timestamp and converted to local time for reporting. It lets you see which hours and days generate the most engagement and, more usefully, which cohorts convert best.
Do all QR codes record scan timing?
Only dynamic QR codes record per-scan timestamps, because each scan passes through a redirect server that logs the event. Static QR codes encode the destination URL directly, so no server intercept occurs and no timing data is captured.
How long does a dynamic QR code remain active?
A dynamic QR code remains active as long as the platform hosting its redirect URL is operational. Qrlytics guarantees that codes created during an active subscription remain functional permanently, regardless of subsequent billing status.
Should I be cautious about what QR scan data reveals about users?
Timestamps and device metadata can constitute personal data under UK GDPR when they are linkable to an identifiable individual. Apply data minimisation, pseudonymise device identifiers, and document your lawful basis for analytics before enriching scan data with CRM or conversion records.
What happens when someone scans a QR code?
Their device reads the encoded URL, sends a request to the redirect server, which logs the scan event (including timestamp and device metadata), and then forwards the user to the destination page. The whole process typically completes in under a second.