Marketers: QR Code Dashboard (Power BI) with Metrics & Permanent Links
A QR code dashboard gives you scan analytics, geographic and device breakdowns, and control over where a code points, without reprinting anything. The recommended path is simple: generate a dynamic QR code, watch the dashboard for scan patterns from day one, and treat the data as you would any other campaign channel. Qrlytics builds this workflow around dynamic tracking that follows industry-standard analytics behaviours you’ll recognise from Google Analytics or any decent attribution tool.
TL;DR:
- Dynamic QR codes enable destination changes and scheduled redirects without reprinting, supporting flexible campaign adjustments and A/B testing.
- Real-time dashboards should offer instant scan updates, geo heat maps, device attribution, and easy destination editing to ensure accurate, actionable insights.
- Ensuring code permanence requires platforms that keep codes functional regardless of subscription status, preventing dead links on printed materials over time.
- Access controls and multi-device responsiveness are crucial for team collaboration, safeguarding destination edits and providing reliable on-the-go campaign monitoring.
- Free tiers may limit analytics and activate code deactivation risks, so testing export options and permanence guarantees before large-scale printing is essential.
Table of Contents
- What a QR code dashboard is and why marketers use one
- Core dashboard features to look for
- How dynamic QR codes and dashboards capture analytics
- Integrations and embedding: from Power BI tiles to marketing stacks
- Set up a QR code dashboard campaign: step by step for marketers
- Publisher platform proof points
- User access control and permissions inside the dashboard
- Mobile app or multi-device dashboard accessibility
- Comparing QR code dashboard pricing models
- Editorial perspective: when dashboards are worth the subscription
- How to start with QRlytics
- Authoritative resources and documentation
- Sources
- FAQ
What a QR code dashboard is and why marketers use one
A QR code dashboard is the reporting layer sitting behind a dynamic QR code. Every scan gets logged, timestamped, and pushed into a set of visual reports you can check from a phone, laptop, or shared team login.
The distinction that matters most is dynamic versus static. A static QR code hard-codes a destination URL directly into the image pattern, so once you print it, that link is fixed forever. A dynamic QR code instead points to a short redirect link you control, which means you can change the destination, run scheduled redirects, or A/B test two landing pages without touching the printed artwork. Dashboards only work with dynamic codes, because the redirect layer is what actually captures the data.
For marketers, that redirect layer supports several distinct jobs:
- Campaign attribution — knowing whether a scan came from a billboard, a flyer, or a product label, using separate codes or UTM parameters per placement.
- Audience geography — seeing which cities, regions, or countries are actually engaging, useful for deciding where to expand a print run.
- Device split — checking how many scans came from iOS versus Android, which affects landing page design decisions.
- A/B destination testing — pointing two identical-looking codes at different pages to see which converts better.
Most dashboards report the same core fields: total scan count, timestamp of each scan, country or city, device type, and referrer where available. Scan count and timestamp tell you campaign momentum, whether a poster gets hit the hardest on a Monday morning commute or a Saturday market stall. Location data tells you where to reallocate print budget. Device split informs whether your landing page needs a mobile-first redesign. Referrer data, when present, helps separate organic curiosity scans from those driven by a specific print run or partner placement.
Core dashboard features to look for
Not every QR platform gives you the same depth of reporting, and the gap between a basic generator and a genuine QR code management tool shows up fast once a campaign scales past a handful of codes. Run through this checklist before committing to a vendor demo or annual plan.
- Real-time scan timelines and alerting. You want scans appearing on the dashboard within moments, not batched overnight, plus the option to get notified when scan volume spikes or drops unexpectedly.
- Geo heat maps and location granularity. A heat map view should let you zoom from country level down to city, since a national campaign and a single-store promotion need very different resolution.
- Device and referrer attribution. Confirm the platform separates mobile operating systems and, where possible, tags the source channel.
- Editable destinations without reprinting. This is the entire point of going dynamic. Check you can change the URL, or even schedule a future redirect, from the dashboard itself.
- Design and branding controls. Logo placement, custom colours, and frame styles matter for print-ready assets, and you’ll want print-safe export formats (high-resolution PNG or vector SVG) rather than a low-res screen grab.
- Campaign organisation and tagging. Folders, tags, or campaign groups become essential once you’re running more than a dozen codes across regions or product lines.
- APIs, webhooks, and CSV exports. Anyone feeding scan data into another system needs a documented API and the option to push events via webhook rather than manually pulling reports.
- Compliance and permanence guarantees. Ask directly whether codes stop working if a subscription lapses. Many free generators deactivate codes the moment payment fails or a plan is cancelled, which is disastrous if that code is printed on ten thousand product boxes.
Pro Tip: Test the export function before you buy, not after. A dashboard that looks polished on screen but only offers a locked PDF report is no use if your finance team needs raw CSV data for a spreadsheet model.
How dynamic QR codes and dashboards capture analytics
The tracking mechanism behind every dynamic QR code follows the same basic pattern. When someone scans the code, their phone camera reads an embedded short link rather than the final destination. That short link hits the platform’s server first, the server logs the scan event, then it redirects the phone to wherever the code owner has pointed it. This single extra step is what makes analytics possible at all.
Some data points from that process are highly reliable. Timestamp is exact, since the server logs the moment the request arrives. Device type is also dependable, pulled directly from the phone’s browser user agent string. Location is a different story: dashboards typically infer geography from the scanning device’s IP address, which gives you city or region-level accuracy rather than precise GPS coordinates. Treat location data as a strong directional signal, not survey-grade precision.
Reporting speed is usually described as near real time rather than instant, because most platforms batch-process a short queue of events before writing them to the dashboard. A few seconds of lag is normal and doesn’t affect attribution quality for typical campaign timelines.
For teams running more sophisticated reporting, the export layer matters as much as the dashboard itself:
- API access for pulling scan events directly into a data warehouse or custom application.
- CSV export for quick spreadsheet analysis or sharing with a client who doesn’t have dashboard access.
- Webhooks for triggering automated actions the moment a scan event fires.
On the privacy side, GDPR-compliant tracking generally means anonymising or minimising personal data collected at scan time, and giving scanned users clear information about what’s logged. It’s worth checking a platform’s own privacy documentation rather than assuming, since regional privacy rules and opt-out mechanisms vary. Microsoft’s own privacy choices reference is a useful example of the kind of disclosure a compliant platform should offer.
Integrations and embedding: from Power BI tiles to marketing stacks
If your organisation already lives inside a business intelligence tool, you have two realistic paths: use the QR platform’s native dashboard for day-to-day monitoring, or export the raw scan data into your existing BI stack for deeper cross-source analysis.
Native dashboards win on speed. You get pre-built charts, heat maps, and filters without writing a single query, which suits most campaign managers checking performance daily. Exporting into a BI tool wins when you need to join scan data against sales figures, CRM records, or other campaign channels that live outside the QR platform entirely.
Microsoft’s Power BI offers a genuinely useful concrete example of embedding. Power BI supports generating a QR code for a dashboard tile, so a user can print that code and scan it to open the exact tile directly in the Power BI mobile app, useful for field teams who need a live report without navigating a full BI interface on a small screen. It’s a different use case from campaign attribution tracking, but it shows how QR codes and structured dashboards are converging as a reporting pattern across the wider software industry, and Microsoft’s Learn Blog documents further implementation notes for teams building on that pattern.
The connector types worth knowing:
- CSV export for manual analysis or archiving.
- REST API access for custom integrations or scheduled data pulls.
- Webhooks for near-instant event forwarding into other systems.
- Native BI connectors, where available, for direct pipeline connections.
Practical use-cases stack up fast: retail chains rolling out shelf-edge codes across hundreds of locations, event organisers tracking check-in scans by gate, and packaging teams monitoring how many customers scan a code on a physical product after purchase.
Set up a QR code dashboard campaign: step by step for marketers
Getting a campaign live and generating usable dashboard data doesn’t need to take longer than a couple of days. Here’s the sequence that avoids the most common mistakes.
- Choose dynamic, then name and tag the campaign. Give it a clear internal name and a tag or folder so it’s findable once you’re running several campaigns at once.
- Design and brand the code. Add your logo, adjust colours for contrast, and choose a frame style, then export a high-resolution or vector file suitable for print.
- Test scanning across devices before printing anything. Check the code on at least one iPhone and one Android device in normal indoor lighting, not just under a desk lamp.
- Set the destination, or schedule redirects if the campaign has phases. A launch-week landing page and a follow-up page for week two, for example, can be scheduled in advance rather than manually swapped.
- Deploy across your chosen channels and watch early scan velocity. The first 48 hours reveal print problems fast, low contrast, a code printed too small, or poor placement all show up as unusually low scan counts relative to distribution volume.
- Pull an initial report, set alert thresholds, and adjust. If one placement is dramatically underperforming another, that’s your signal to fix the print, not the code.
Pro Tip: Print a handful of test codes at the actual final size before committing to a full run. A code that scans perfectly on your monitor can fail on a poster if it shrinks below roughly 2cm square, and no dashboard fix reverses a bad print.
Our practical guide to QR code tracking walks through measurement setup in more depth if you’re building your first multi-channel campaign.
Publisher platform proof points
Qrlytics was built around a specific problem: codes that stop working the moment a subscription lapses or a payment fails, leaving a print run of flyers, packaging, or signage pointing at a dead link. Codes created during an active Qrlytics subscription remain functional permanently, regardless of later billing status, which removes the single biggest risk in relying on QR codes for physical marketing.
The platform includes dynamic URL updates so destinations can change without reprinting, real-time analytics with geo heat maps for location reporting, GDPR-compliant tracking, and both API and CSV export for teams building custom reporting pipelines. Together these cover the practical needs of a business running dozens or hundreds of codes across multiple campaigns.
The core promise is simple: a code printed today should still work in three years, whether or not the marketing team that created it is even at the same company anymore. Permanence isn’t a feature. It’s the baseline every QR platform should have started with.
That focus on analytics and permanent code functionality is what separates a dashboard built for long-term campaign ownership from a free generator that treats codes as disposable.
User access control and permissions inside the dashboard
Most teams running QR campaigns aren’t a single person managing every code. A marketing manager, a designer, an agency contact, and sometimes a client all need some level of dashboard access, but rarely the same level.
Role-based permissions solve this by separating what different users can see and do. A common structure gives an admin full control over billing, user management, and every campaign, while a standard editor can create and edit codes and view analytics but can’t touch account settings or invite new users. A read-only viewer role, useful for clients or stakeholders who just want to check performance, sees the reports without the ability to change a live destination.
This matters more than it first appears. A dynamic QR code’s biggest strength, editing the destination without reprinting, is also its biggest risk if the wrong person can redirect a live code printed on thousands of physical items. Locking down who can edit destinations versus who can only view analytics prevents an accidental or unauthorised change from breaking a campaign already in the field.
For agencies managing codes on behalf of multiple clients, look specifically for the ability to segment campaigns by client account, so one client’s team never sees another client’s scan data or destination settings. That separation is often the deciding factor between a dashboard suitable for internal use only and one genuinely built for agency or enterprise use.
Mobile app or multi-device dashboard accessibility
Campaign monitoring rarely happens exclusively at a desk. Field teams checking a heat map before an event, a marketer glancing at scan counts between meetings, or an agency account manager reviewing numbers on a train all need dashboard access that doesn’t depend on a specific device.
The practical standard is a responsive web dashboard that renders cleanly on a phone browser without requiring a dedicated app download. This tends to suit marketing teams better than a native app, since it means no separate login to manage, no app store update cycle, and instant access from any device with a browser.
Some platforms do offer dedicated mobile apps, which can add value for push notifications on scan alerts or offline code scanning for verification purposes. But the core requirement for most marketers is simpler: log in from a laptop in the morning, check the same dashboard from a phone at a trade show in the afternoon, and see identical, up-to-date data both times.
Multi-device consistency also matters for teams collaborating across time zones. A dashboard that syncs instantly across sessions, rather than caching stale data on one device, avoids the scenario where two team members are looking at different scan counts for the same campaign at the same time.
Comparing QR code dashboard pricing models
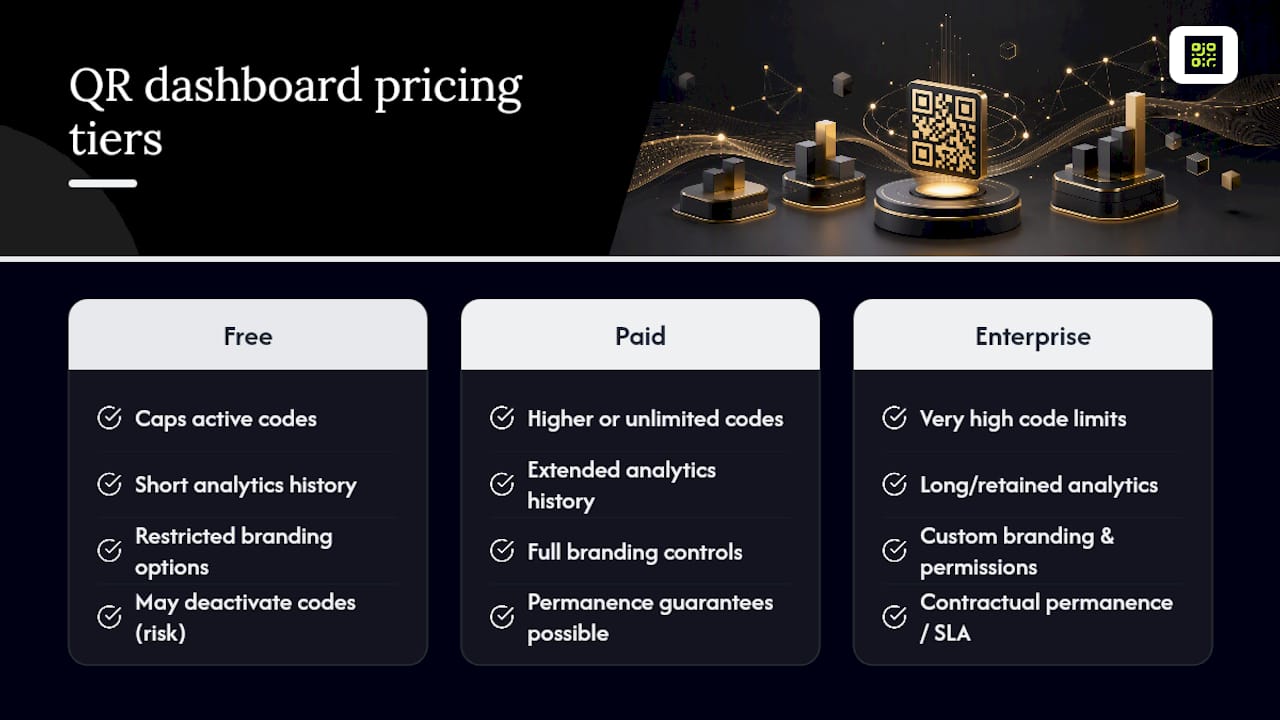
Pricing across the QR dashboard market generally splits into three tiers, and understanding the model matters more than comparing headline prices, since the real cost driver is usually how a platform limits free usage rather than the paid tier itself.
Free tiers typically cap the number of active codes, limit analytics history to a short window, and often restrict branding options like custom colours or logo placement. Some free generators, notably, deactivate codes entirely once you’d otherwise need to upgrade, which is the exact permanence risk worth checking before you print anything at scale.
Paid subscription tiers, usually billed annually, unlock unlimited or substantially higher code limits, extended analytics history, full branding controls, and API access. This is where most small businesses and mid-size marketing teams land, since campaign volume quickly outgrows a free allowance once you’re running more than a few active promotions.
Enterprise pricing generally adds dedicated support, higher API rate limits, advanced permission structures for large teams, and sometimes custom contractual permanence or SLA guarantees. Retailers running codes across hundreds of store locations or publishers embedding codes in every print issue tend to need this tier.
The comparison that actually matters isn’t feature checklists side by side. It’s whether a given platform’s free tier lets you validate the workflow risk-free, and whether its paid tier’s permanence guarantee protects the print investment you’re about to make.
Editorial perspective: when dashboards are worth the subscription
A dashboard earns its subscription cost once you’re running repeat campaigns, multiple locations, or anything printed in volume where a dead link means wasted materials, not just a missed click. A single static code on a one-off flyer for a local event genuinely doesn’t need analytics behind it.
The trade-off is real: dynamic tracking costs money and adds a small layer of complexity over a plain static code. But the moment you need to answer “did this work,” or you’re printing anything you can’t easily reprint, that complexity pays for itself. Ask yourself two questions before choosing: how many times will this code be scanned, and how expensive would it be to fix a mistake after printing? If either answer is large, get a dashboard.
How to start with QRlytics
Testing whether a dashboarded workflow suits your campaigns doesn’t require a commitment upfront. Qrlytics offers a free tier with no credit card required, so you can create a dynamic QR code and check the dashboard’s real-time scan reporting before deciding whether it fits your marketing stack.
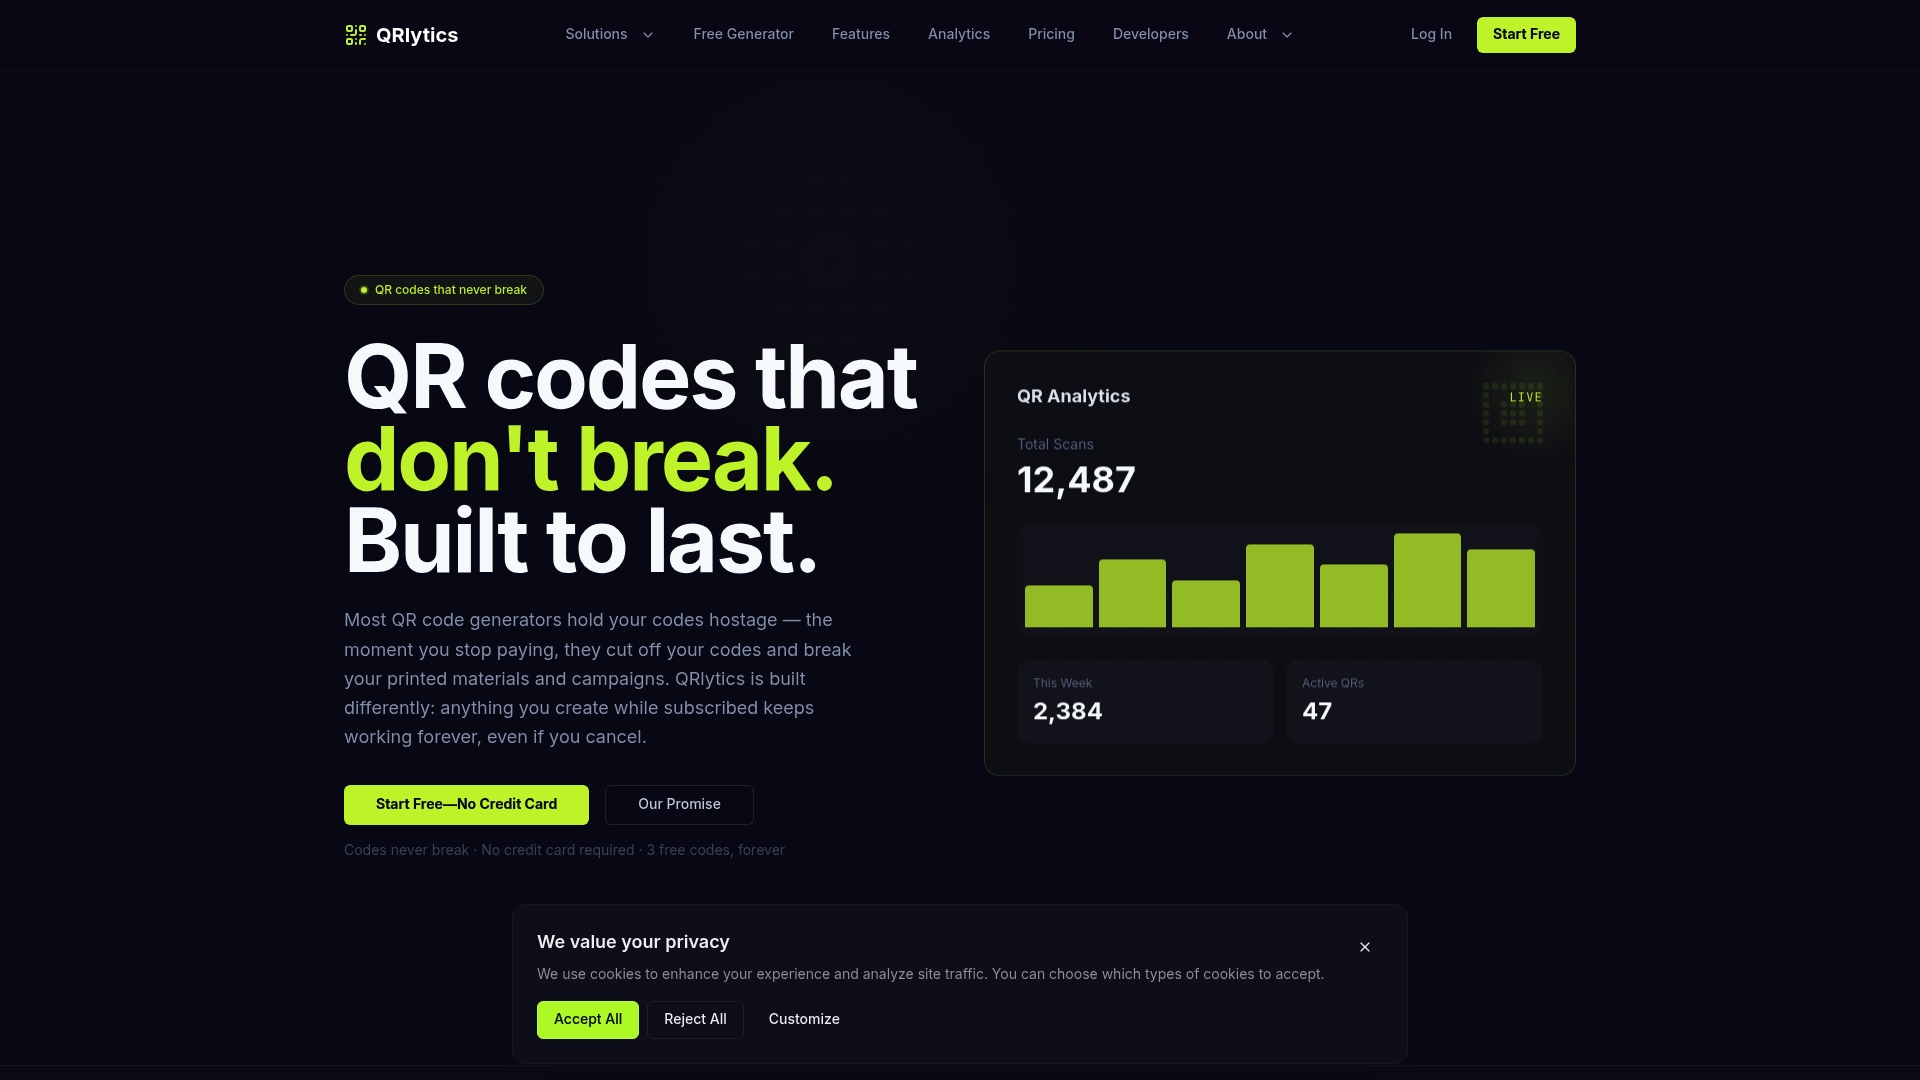
The free tier covers enough active codes and analytics to validate the workflow on a real campaign, not just a demo. When you’re ready for more, upgrading unlocks the permanence guarantee across your full code library, deeper analytics history, geo heat maps, and API access for teams building custom reporting pipelines. Enterprise plans add higher usage limits and account-level permission controls for agencies managing multiple clients.
If you’ve been burned before by a free generator deactivating a code mid-campaign, the dynamic QR code generator is built specifically to remove that risk from the equation. Sign up, generate one code, print it small-scale, and check the dashboard within 48 hours. That’s the fastest way to know whether it earns a permanent place in your marketing toolkit.
Authoritative resources and documentation
For further reading, Microsoft documents the Power BI QR tile feature directly, and its privacy choices reference offers a useful model for the kind of disclosure a compliant tracking platform should provide.
Sources
- Create a QR code for a tile in Power BI to use in the mobile apps
- Microsoft Learn Blog (Tech Community)
- Aka
FAQ
How do I display my QR code?
Export your code as a high-resolution PNG or vector SVG file from your dashboard, then place it on printed materials, packaging, or digital screens at a minimum size sufficient for reliable scanning.
What is the FBI warning about QR codes?
Security agencies have warned that scammers sometimes place fraudulent QR code stickers over legitimate ones to redirect victims to phishing sites, so always check a code hasn’t been tampered with before scanning, and use platforms with verified, permanent redirect links.
Is there a free QR code website?
Yes, several platforms including Qrlytics offer a free tier that lets you generate a dynamic QR code with no credit card required, though free tiers typically cap the number of active codes and analytics history.
How do I view my QR code?
Log into your dashboard account to see every code you’ve created, along with its current destination, design settings, and scan analytics, from any device with a browser.