QR code ROI measurement: a practical framework for marketers

You measure QR code ROI reliably by connecting every scan to a conversion and a revenue figure, using a dynamic redirect, a UTM-tagged destination, and one record per placement as your single source of truth. Without those three elements, you’re counting scans, not measuring return.
Before you print another poster or badge, get these fundamentals in place:
- Use a dynamic QR code or short link, never a static one, so you can edit the destination and capture scan metadata.
- Append UTM parameters to the landing URL so analytics platforms can attribute sessions correctly.
- Build (or point to) a dedicated landing page that matches the placement’s message.
- Log one row per placement in a tracking sheet: QR file name, tracked URL, launch date, and target metric.
Pro Tip: When you calculate cost, include everything, not just media spend: design time, printing, the dynamic hosting fee, landing-page build, and the hours your team spends briefing and reviewing. Campaigns that look profitable on ad spend alone often break even once labour is counted.
Key Takeaways
Reliable QR code ROI measurement depends on dynamic redirects, standardised UTM tagging, and one placement-level record that ties every scan to a documented conversion and revenue figure.
| Point | Details |
|---|---|
| Use the right formula | Calculate ROI as (Revenue − Cost) ÷ Cost × 100%, including labour and platform fees in cost. |
| Track metrics beyond scans | Monitor unique scans, scan velocity, conversion rate, and cost per scan to diagnose placement performance. |
| One code per placement | Never reuse a single QR code across multiple placements; it destroys comparability. |
| Build a defensible attribution trail | Combine UTMs with coupon codes or order IDs so revenue claims survive scrutiny. |
| Choose permanence for scale | Qrlytics keeps codes functional indefinitely once created on an active subscription, preventing wasted print runs from expired or broken redirects. |
Table of Contents
- What is QR code ROI measurement and how do you calculate it?
- Core QR code performance metrics that build up to ROI
- How does QR code tracking actually work?
- Building a reusable QR measurement framework
- Best practices for increasing QR code ROI
- Attributing QR scans to revenue
- Common QR measurement mistakes that invalidate your ROI figures
- When does a QR management platform pay for itself?
- What separates a measured QR programme from a gimmick
- A practical next step for measuring your own QR campaigns
- Sources
What is QR code ROI measurement and how do you calculate it?
QR code ROI measurement is the process of tying scan activity to attributable revenue or value, then expressing that return against total campaign cost. The formula itself is simple: (Revenue − Cost) ÷ Cost × 100%. A print insert campaign that generates more than triple its cost in attributed sales returns a strong ROI. The arithmetic is easy. Getting clean, trustworthy inputs for revenue and cost is where most teams stumble.
Cost should include design and artwork, printing or production, the dynamic QR platform fee, landing-page build or update time, internal labour for briefing and reporting, and any paid media used to drive people to the placement. Leaving out labour is the most common understatement.
Return should include attributed revenue from tracked sessions, the value of coupon redemptions, and non-monetary outcomes when they matter to the business, such as newsletter signups or app installs, valued at an agreed proxy figure.
For acquisition-focused campaigns, a raw ROI figure can look weak in the first month because new customers haven’t spent their full value yet. Adjusting the return using customer lifetime value, rather than first-purchase revenue alone, gives a fairer picture of a QR code’s actual contribution and stops you killing a channel that’s working over a longer horizon.
Core QR code performance metrics that build up to ROI
Scans alone tell you almost nothing about whether a QR code campaign worked. Metrics that matter go beyond scan counts and follow a hierarchy: exposure, engagement, intent, and outcome. Each layer explains a different part of performance.
- Total scans: the raw count, useful as a baseline but easily inflated by curiosity scans that never convert.
- Unique scans: strips out repeat scanning from the same device, giving a truer reach figure.
- Scan velocity: scans over time, which flags whether a poster is being noticed on day one or ignored until a price drop or event peak.
- Geographic performance: shows which physical locations or regions are driving activity, critical for multi-site retailers or event chains.
- Landing-page engagement: time on page and scroll depth reveal whether the destination actually matches what the code promised.
- Scan-to-conversion rate: the percentage of scans that complete the intended action, whether that’s a purchase, signup, or redemption.
- Cost per scan (CPS): total cost divided by scans, a placement-comparison metric more than a standalone target.
- Payback period: how long it takes attributed revenue to cover the placement’s cost.
CPS varies enormously by format. One documented comparison shows a $3,000 billboard generating 600 scans against a $200 product insert generating 400 scans, producing wildly different cost-per-scan figures despite similar scan volumes. That gap only becomes meaningful once you layer conversion rate and average order value on top.
The metrics aren’t decoration. They’re the difference between scaling a placement type and quietly dropping it.
How does QR code tracking actually work?
A scan becomes measurable data through a specific chain: someone scans the code, the QR redirects through a server, that server sends them to a tracked URL carrying UTM parameters, they land on a page, and your analytics platform logs a session and, ideally, a conversion event. Break any link in that chain and you lose visibility.
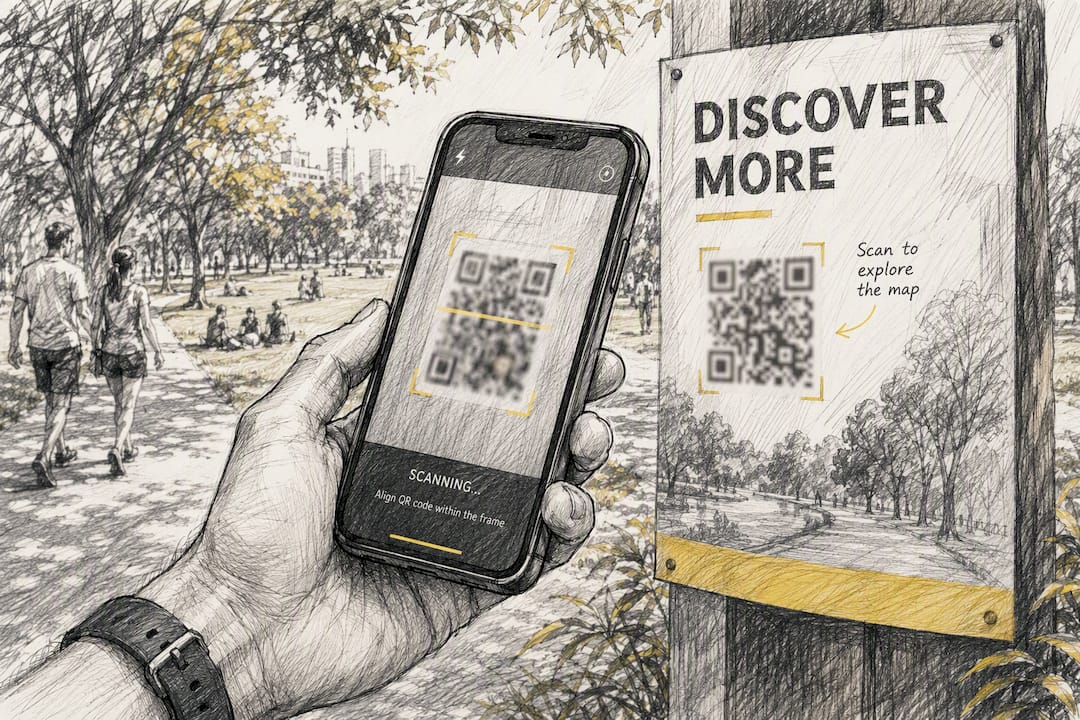
This is why dynamic QR codes matter so much more than static ones for anyone serious about measurement. A static code encodes the destination URL directly into the pixel pattern. It cannot be edited, and it generates no scan data of its own. Dynamic codes and redirect-based short links are essential for reliable measurement because the code points to a redirect service rather than the final page, which means you can change the destination after printing and the platform logs every scan independently of your web analytics.
To build a workable tracking setup, you need four components:
- A redirect or short-link service that logs scans and lets you update destinations without reprinting.
- A consistent UTM standard so every placement is tagged the same way.
- A landing-page map that shows which URL belongs to which physical placement.
- A source-of-truth dashboard or spreadsheet that ties scan logs to analytics sessions and conversion events.
Google’s own campaign tagging guidance confirms that UTM parameters are what let Analytics platforms attribute sessions and conversions to a specific source and medium rather than lumping QR traffic into generic “direct” traffic, which is one of the most common ways QR performance gets hidden entirely.
Pro Tip: If your QR code opens an app rather than a webpage, use deep-link attribution tools that pass the same UTM-style parameters through the app install flow. Without that, you’ll see the scan in your redirect logs and a completely disconnected install in your app analytics, with no way to join the two.
Building a reusable QR measurement framework
A reliable measurement framework answers five questions for every single placement, and if you can’t answer all five, your data won’t hold up under scrutiny:
- Where was the code seen? The physical or digital placement, described specifically enough to distinguish it from similar ones.
- Which audience saw it? The segment or context, such as event attendees, in-store shoppers, or direct mail recipients.
- What was the intended action? Purchase, signup, download, or another defined outcome.
- What happened after the scan? Session data, engagement, and conversion status.
- How does this compare to other results? Benchmarked against other placements, campaigns, or timeframes.
A practical spreadsheet turns these questions into fields. One row per placement, with columns for: final landing page, tracked URL with UTMs, short link, QR file name, QR version number, placement description, target metric, launch date, review cadence, and a free-text notes column for context that numbers won’t capture.
Standardise your UTM tags before you print anything. A workable convention looks like this:
utm_source=print(orevent,packaging,instore)utm_medium=qrutm_campaign=spring_sale_2026utm_content=window_poster_v2
This structure means one code per meaningful placement, not one code per campaign. Reusing a single QR code across a poster, a flyer, and a badge collapses all three data sets into one, and you lose the ability to tell which placement actually worked. Event campaigns illustrate this sharply: badges, table cards, and stage slides need separate codes, or you can’t tell whether attendees scanned at check-in or during the keynote.
Set a monitoring cadence and stick to it:
- 48-hour QA check: confirm the redirect works, the landing page loads, and analytics is capturing sessions correctly.
- Weekly checks during an active campaign, watching scan velocity and conversion rate for anomalies.
- Campaign-close summary, comparing final ROI against the original target.
- Monthly or quarterly reviews for packaging and long-running placements that don’t have a defined end date.
Best practices for increasing QR code ROI
Higher ROI starts before the code is even generated. Define a single primary success metric for each placement, whether that’s revenue, signups, or app installs, and design everything around that one goal rather than trying to serve three objectives with one code.
Stick to one QR code per meaningful placement and make sure the landing page matches the promise on the printed material. Offer clarity in the call-to-action copy, whether it’s “Scan to claim your discount” or “Scan for the full menu”, removes the hesitation that costs you scans.
On design, contrast and size matter more than most marketers assume. A code smaller than 2cm square struggles at typical scanning distance, and low-contrast colour combinations, particularly light grey on white, cause scan failures that never show up in your data because the person simply gives up. Tactical guidance on scan intent covers placement height, lighting, and surrounding copy in more depth.
Testing should be continuous, not a one-off exercise. A/B test landing pages against each other using the same QR code family, rotate offers across similar placements to see which converts better, and treat event placements as short, compressed test windows where scan velocity in the first hour tells you almost everything about whether the placement is working. Comparing packaging, posters, and event badges through the same measurement framework, rather than judging each in isolation, is what lets you reallocate budget with confidence rather than guesswork.
Pro Tip: Data-enabled QR formats can lift engagement further when the placement supports it. Smart QR codes that adapt content by context are worth testing on high-traffic placements where you have the volume to justify the added complexity.
Attributing QR scans to revenue
Turning a scan into a defensible revenue figure requires more than a single analytics report. The strongest setups combine UTM-based session tracking with a second, independent signal, such as a unique coupon code, a server-side order ID capture, or a form token generated after the scan.
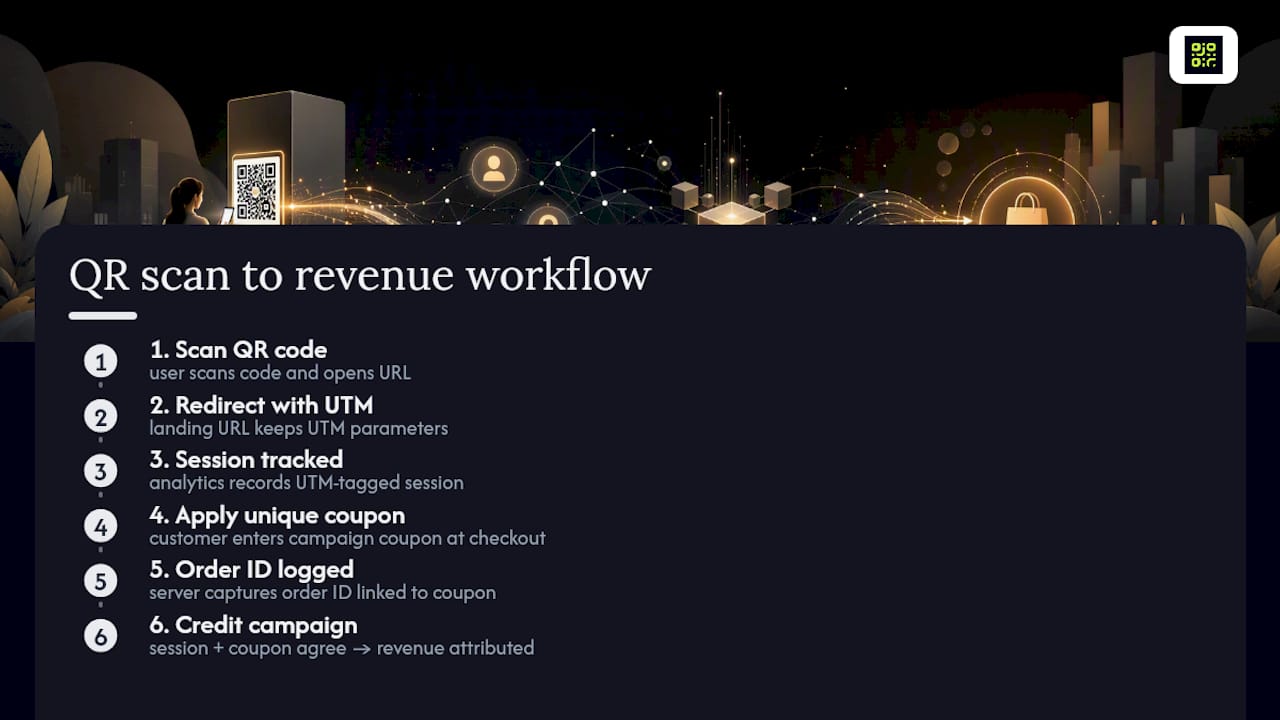
A typical workflow looks like this: someone scans the code, lands on a tracked session with UTM parameters intact, applies a unique coupon code at checkout, and your order system logs that coupon against a specific order ID. The campaign gets credited with that revenue because two independent data points, the session and the coupon, agree. Retail campaigns increasingly rely on deep-linking to connect scans directly to app installs and purchase events, which matters if your conversion happens inside an app rather than a browser.
Multi-touch scenarios complicate this. A customer might scan a poster, browse without buying, then return later through a Google search and convert. Document your attribution assumption plainly in every report, whether that’s last-touch, first-touch, or a 7-day scan-to-conversion window, so stakeholders know exactly what the ROI figure does and doesn’t claim. A defensible report states its assumptions; an inflated one hides them.
Common QR measurement mistakes that invalidate your ROI figures
Several recurring errors quietly corrupt QR data, and most of them are invisible until someone asks why the numbers don’t add up.
- Expired or shared codes: a code left live after a campaign ends, or reused across an unrelated promotion, blends unrelated data together.
- Missing UTMs: a redirect without campaign tags shows up as unattributed or direct traffic, hiding the channel’s real contribution.
- One code across multiple placements: destroys your ability to compare performance by location or format.
- Scan logs versus analytics mismatches: if your redirect service counts more scans than your analytics platform counts sessions, something in the chain is broken, often a slow-loading landing page losing people before the pageview fires.
- Counting exposure as conversion: a scan is interest, not a sale. Reporting scan totals as if they were revenue overstates performance to anyone reviewing the numbers.
Catch these early with daily redirect checks during live campaigns and periodic spot-checks confirming that a scan on the physical code actually produces a logged session.
When does a QR management platform pay for itself?
A spreadsheet and a free QR generator work fine for one or two placements. The maths changes once you’re running multiple campaigns, need to edit a destination after printing, or want aggregated analytics across locations without manually stitching together exports.
The tipping point usually arrives when you hit three or more active placements, need lifecycle scheduling (swapping a code’s destination automatically once a promotion ends), or require API access to pull scan data into a broader reporting tool. At that volume, manually managing redirects and cross-referencing spreadsheets becomes a bigger time cost than the platform fee itself.
A dedicated platform typically brings:
- Dynamic URL updates, so a printed code never points to a dead campaign page.
- Per-scan metadata including timestamp, approximate location, and device type.
- Global heat maps showing exactly where geographic performance is strongest.
- GDPR-compliant tracking, which matters increasingly for any campaign collecting location or device data from EU or UK audiences.
- Stable redirection that prevents a code from silently breaking, which is the single most common way printed materials get wasted.
Pro Tip: Before committing budget to a large print run, test the platform’s redirect stability on a small placement first. A code that stops resolving because of a billing lapse or platform issue turns an entire print run into waste, which is precisely the failure mode a permanent-code guarantee is designed to prevent.
What separates a measured QR programme from a gimmick
Most QR failures aren’t a design problem or even a targeting problem. They’re a naming and cadence problem. Teams that treat every placement with a stable UTM convention, one code per meaningful location, and a fixed review schedule consistently outperform teams chasing a cleverer creative concept, because measurement discipline, not aesthetics, is what separates a repeatable QR programme from a novelty.
The mindset shift that actually matters is thinking of a QR code as a piece of link infrastructure you manage over months, not a design asset you print once and forget. Print production teams get this wrong constantly, treating the code as a final creative element rather than the first link in a tracking chain that needs the same attention as any digital campaign.
A practical next step for measuring your own QR campaigns
Everything in this framework, dynamic redirects, UTM discipline, one code per placement, depends on your codes actually staying live for the life of the campaign. That’s the specific gap Qrlytics closes: codes created on an active subscription keep working permanently, so a billing hiccup or a cancelled plan never silently breaks a printed poster or a packaging run you’ve already shipped.
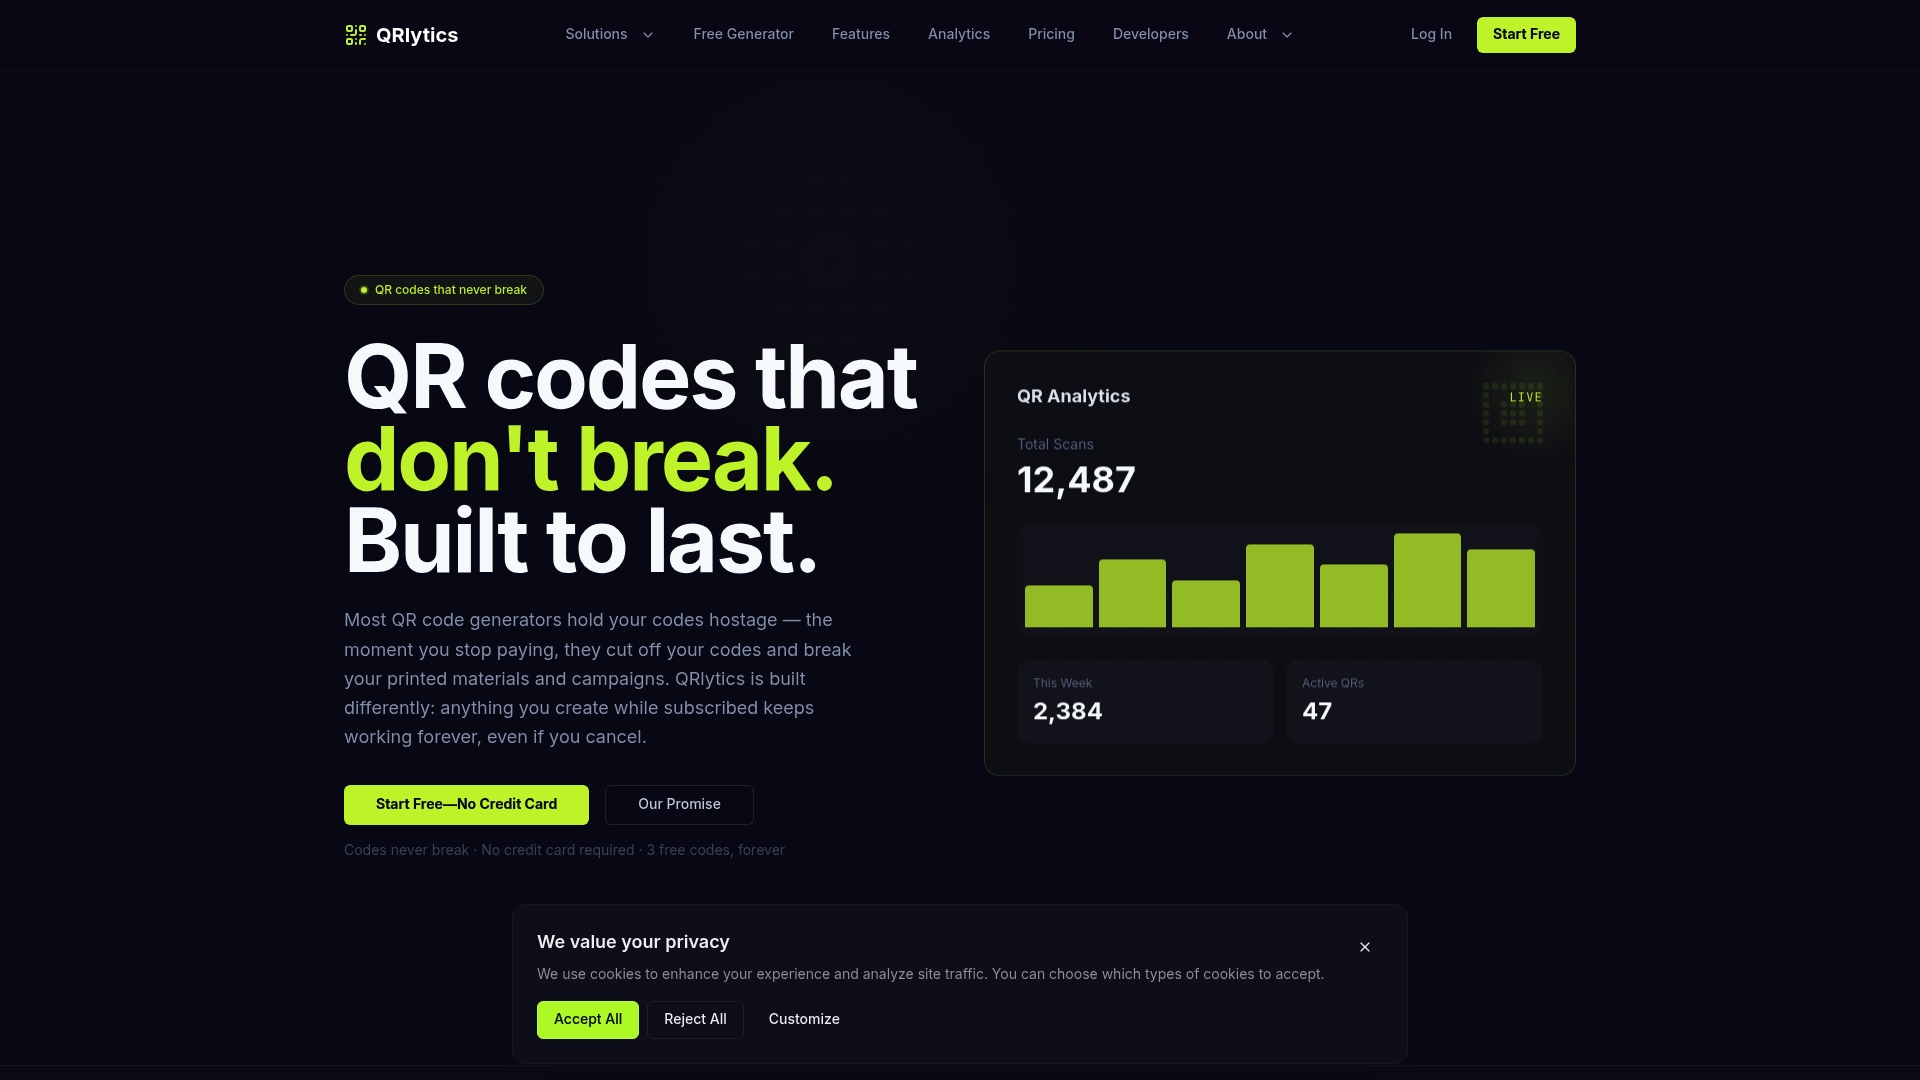
Beyond permanence, Qrlytics gives you the dynamic URL editing, real-time scan analytics, and GDPR-compliant tracking this article has been building towards, plus global heat maps for the geographic performance metric covered earlier and CSV exports for feeding scan data into your broader reporting. If you want to put the measurement framework into practice, start with the free QR code generator on a single placement, or go straight to the dynamic QR code generator if you’re ready to track a full campaign properly. No credit card is needed to get started, so there’s no reason your next print run has to run blind.
Sources
- How to Measure QR Code Performance
- How to Measure QR Code ROI: Formulas, Metrics & Benchmarks | GenerateOnlineQR
- Set up campaign tagging in Google Analytics
- QR Code Tracking: Measuring Retail Campaign Performance
FAQ
How can QR code ROI be measured?
What is the FBI warning about QR codes?
The FBI has warned that fraudsters can paste malicious QR codes over legitimate ones to redirect victims to phishing sites or malware downloads, so businesses should regularly check printed codes for tampering and use platforms with stable, verified redirects.
What counts as a good ROI for digital marketing?
There’s no universal benchmark, since good ROI depends heavily on industry, margin, and campaign objective; the more useful practice is comparing a QR placement’s ROI against your own historical placements of the same type rather than an external figure.
Why is there a QR code character limit around 4,296?
Standard QR codes can encode a large amount of data, but long URLs create denser, harder-to-scan codes, which is why dynamic QR platforms use short redirect links to keep the printed code simple and reliable.
Do static QR codes provide any scan analytics?
No. A static code encodes the destination directly and generates no scan data of its own, which is why dynamic codes with redirect tracking are necessary for any campaign where measurement matters.