Why print campaigns need analytics to prove ROI
Print campaigns need analytics because without measurement, every budget decision is a guess. Treat print as a performance channel, instrument every piece before it goes to press, and you can defend spend with hard data rather than anecdote.
Three steps to act on now:
- Define your goals and KPIs before briefing the printer. Revenue, leads, redemptions, or web visits — pick outcomes that map to your business objectives.
- Add trackable assets to every piece: a QR code with UTM parameters, a personalised URL (PURL), a unique coupon code, or a dedicated phone number.
- Wire those assets into your analytics and CRM so print-driven events appear in the same dashboards as your digital channels. Marketreach (Royal Mail) recommends using consistent tracking parameters and dedicated landing pages so print traffic is visible alongside digital performance.
Qrlytics handles the QR and analytics layer, giving you dynamic codes, real-time scan data, and GDPR-compliant tracking from a single platform.
Key takeaways
Treating print as a measurable performance channel requires tracking assets designed in before printing, KPIs tied to business outcomes, and print data wired into the same analytics and CRM systems used for digital.
| Point | Details |
|---|---|
| Design tracking before printing | Build UTMs, QR codes, PURLs, and coupon codes into the creative before the file goes to press. |
| Use outcome-focused KPIs | Choose KPIs that map to business goals: redemption rate, CPL, attributed revenue, or QR visit rate. |
| Calculate ROI with hard data | Use the formula (attributed revenue − campaign cost) ÷ campaign cost; start with tracked conversions, then add conservative lagged estimates. |
| Integrate into existing dashboards | Wire print events into GA4 and CRM so print appears in cross-channel reports, not a separate silo. |
| Qrlytics for QR and analytics | Qrlytics provides dynamic QR codes, permanent code functionality, UTM pass-through, and GDPR-compliant scan analytics for tracked print campaigns. |
Table of Contents
- Why measuring print campaigns matters for your budget
- How to make your print campaign measurable before it prints
- Which KPIs should you set for a print campaign?
- How to calculate print campaign ROI step by step
- How to wire print tracking into GA4, CRM, and dashboards
- Why Variable Data Printing removes the attribution blind spot
- How measurement lets you test and improve each print run
- Which tools do you need to track a print campaign?
- The case for measuring print: an editorial view
- Qrlytics makes your print campaigns measurable from day one
- Sources
- FAQ
Why measuring print campaigns matters for your budget
Untracked print spend is vulnerable at every budget review. Without data, you cannot show whether a direct mail drop drove revenue or simply cost money. Measurement turns that assumption into a defendable decision.
Industry guidance from NonStop Marketing sets out a four-step process: set goals, choose KPIs, add trackable assets, and calculate ROI from attributed revenue. That framework is the difference between a print programme that survives a budget cut and one that doesn’t.
Measurement also reveals waste. Procurement teams often stop at cost-per-piece, but the real cost picture includes waste-to-print ratio and cost-per-touch. RPI Graphic Data Solutions notes that tracking these operational metrics uncovers savings and points to print-on-demand as a way to reduce overprinting. The advantages of trackable print media extend beyond attribution: they give you the evidence to optimise creative, refine targeting, and prove incremental impact versus digital.
How to make your print campaign measurable before it prints
Analytics must be designed into the creative before the file goes to press. A landing page built after the campaign launches cannot isolate print-driven traffic from organic visits.
Tracking methods to build in:
- QR codes with UTM parameters — a dynamic QR code pointing to
yourdomain.co.uk/campaign?utm_source=print&utm_medium=direct-mail&utm_campaign=spring26lets GA4 attribute every scan to the correct campaign. Use a dynamic QR code generator so you can update the destination URL after printing. - Personalised URLs (PURLs) — a unique URL per recipient (e.g.
yourdomain.co.uk/j.smith) ties a web visit to a named individual in your CRM. - Unique coupon codes — assign a code per batch, region, or individual. Redemption data flows directly into your e-commerce or CRM system.
- Trackable phone numbers — a dedicated number per campaign or region lets you attribute inbound calls to the correct print piece.
- Variable Data Printing (VDP) — each piece carries a unique identifier printed at press, enabling per-recipient attribution without a separate PURL system.
Implementation checklist:
- Create a campaign-specific landing page with a clear, single call to action.
- Build your UTM string and test it in GA4 before generating the QR code.
- Generate a dynamic QR code pointing to the UTM-tagged URL.
- Assign coupon codes by batch or recipient list and record the scheme in your CRM.
- Set up call tracking numbers and map them to campaign records.
- Proof-check all tracking assets on a physical print proof before approving the final run.
Pro Tip: Combine at least two tracking methods on every piece — for example, a QR code plus a coupon code. If a recipient redeems the coupon without scanning the QR, you still capture the conversion. Redundancy protects your attribution data. See how to master QR code campaigns for a full setup walkthrough.
Drukarnia Pro confirms that unique codes, dedicated phone numbers, PURLs, and QR codes pointing to campaign landing pages are the practical mechanics that make print measurable across formats.
Which KPIs should you set for a print campaign?
Pick business outcomes first, then choose KPIs that map to them. A promotional flyer needs redemption rate and cost-per-lead measured within days. A B2B catalogue may need a multi-month window to capture quote requests that convert to contracts.
| KPI | When to use it | How to measure | Measurement window |
|---|---|---|---|
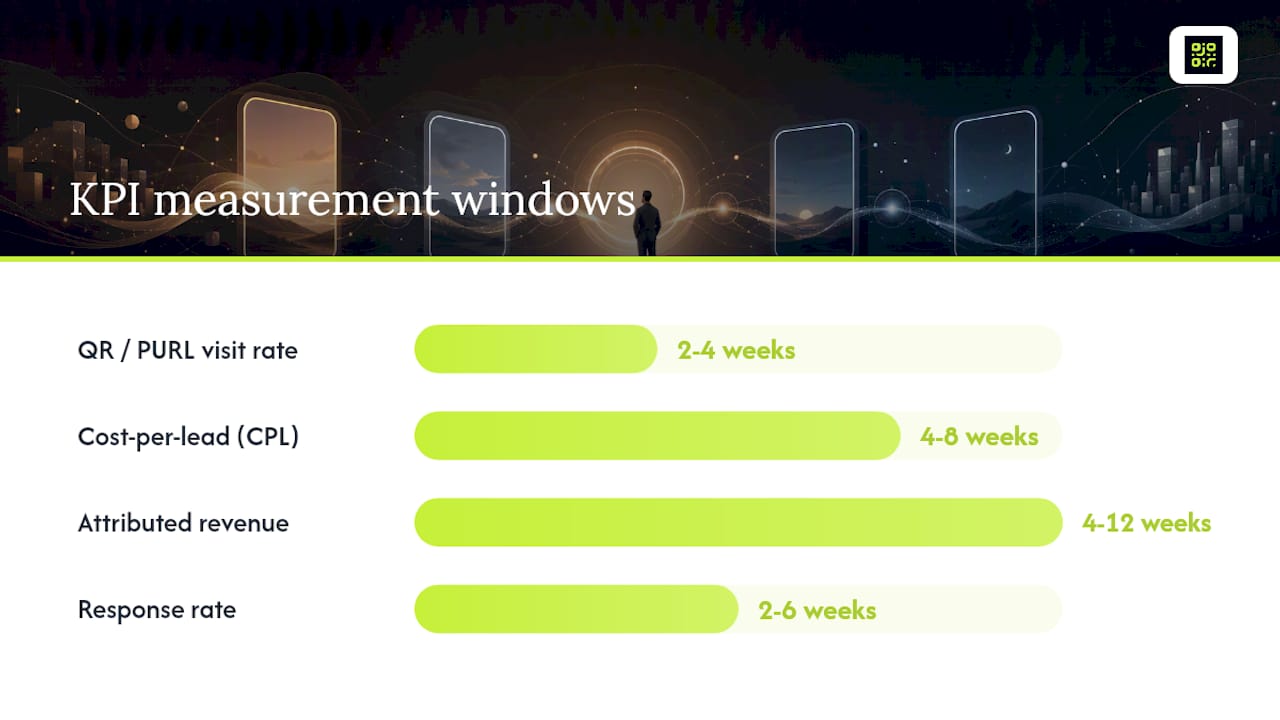
| QR / PURL visit rate | Awareness or web-traffic campaigns | GA4 UTM report | 2–4 weeks post-drop |
| Coupon redemption rate | Promotional offers | CRM or e-commerce redemption report | Offer validity period |
| Cost-per-lead (CPL) | Lead generation | Total print spend ÷ attributed leads | 4–8 weeks |
| Attributed revenue | Direct response | Revenue from tracked conversions | 4–12 weeks |
| Response rate | Prospect acquisition | Responses ÷ pieces mailed | 2–6 weeks |
NEXUScpp provides directional benchmarks: direct mail to cold prospects commonly achieves response rates of 2–5%, while house lists typically perform higher. Use those figures as a sanity check, not a guarantee.
For B2B catalogues, plan a measurement window of several months and capture lead events such as quote requests in your CRM. Drukarnia Pro notes that catalogues build brand equity and trust that converts later, so a short window will undercount their contribution.
How to calculate print campaign ROI step by step
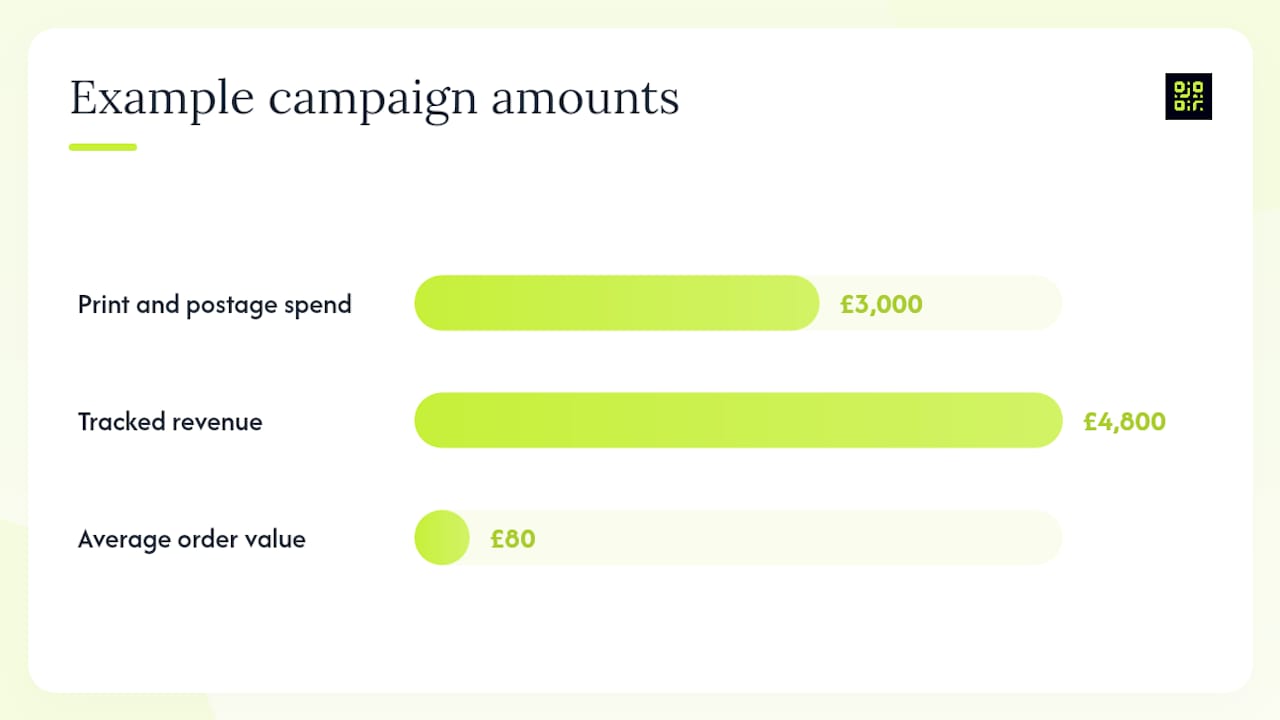
ROI = (revenue attributed − total campaign cost) ÷ total campaign cost. Start with hard, trackable revenue from codes and PURLs, then add a conservative estimate for lagged conversions you can reasonably attribute.
Example in GBP:
- Print and postage spend: £3,000
- Tracked conversions via QR and coupon codes: 60 orders
- Average order value: £80
- Tracked revenue: £4,800
- ROI: (£4,800 − £3,000) ÷ £3,000 = 60%
Attribution approaches:
- Single-touch — all revenue credited to the print piece that drove the first tracked interaction. Simple, but understates print’s role in multi-channel journeys.
- Multi-touch — revenue shared across print and digital touchpoints. Requires CRM data linking print interactions to later digital conversions.
- Holdout groups — mail to 80% of a list and hold back 20%. The difference in purchase behaviour between the two groups is your incremental lift. RPI Graphic Data Solutions recommends this approach where direct attribution is difficult.
Pro Tip: Run a small lift test before scaling. Mail 500 pieces to a randomly selected subset of your list, hold back 100, and compare conversion rates over four weeks. The result gives you a credible ROI estimate to present to finance before committing to a full run.
How to wire print tracking into GA4, CRM, and dashboards
Marketreach advises against building a separate reporting silo for print. Include print-driven events in your existing analytics so they appear in cross-channel reports alongside paid search and email.
Stepwise wiring:
- Design tracking assets (UTMs, QR codes, PURLs, coupon codes) before briefing the printer.
- Build a campaign-specific landing page that matches the print message exactly.
- Tag the landing page URL with UTM parameters (
utm_source,utm_medium,utm_campaign). - Set up a GA4 custom event (e.g.
print_campaign_visit) triggered on landing page load. - Populate a CRM lead field with the campaign source so sales teams see print-originated leads.
- Pull GA4 and CRM data into your reporting dashboard for a unified view.
UK GDPR note: Collect only the data you need, document your lawful basis (typically legitimate interest or consent for direct mail), and set a clear retention period. The ICO’s direct marketing guidance is the authoritative reference for UK practice.
Pro Tip: Use the QR code tracking guide for marketers to confirm your UTM strings pass through QR redirects intact — a misconfigured redirect strips parameters and breaks attribution.
Why Variable Data Printing removes the attribution blind spot
Variable Data Printing (VDP) gives every printed piece a unique identifier — a code, QR, or PURL — so each recipient’s response is individually measurable. That removes the attribution blind spot that affects standard batch print.
Common VDP use cases and what they reveal:
- Customer reactivation mail — a unique QR per lapsed customer shows exactly who re-engaged and when.
- Event badges and invitations — per-attendee codes track check-ins and post-event follow-up responses.
- B2B catalogue PURLs — a named URL per prospect ties catalogue receipt to a quote request in the CRM.
- Loyalty vouchers — unique codes per member reveal redemption rates by segment, enabling offer optimisation.
The flow is straightforward: press prints a unique code or QR on each piece, the recipient scans or visits, the landing page fires a GA4 event, and the CRM record is updated. Print Lord describes this per-piece tracking as the mechanism that enables optimisation across successive campaign iterations.
How measurement lets you test and improve each print run
Measurement only creates value when it feeds a repeatable loop: test, learn, scale. A single tracked campaign gives you a baseline; the second run is where improvement happens.
A three-step test plan:
- Pilot — run a tracked campaign to a representative subset of your list. Measure redemption rate, CPL, and QR visit rate.
- Learn — identify the highest and lowest performing creative variants, offers, and segments. Check holdout group lift.
- Scale — roll out the winning variant to the full list, adjusting creative, offer, or targeting based on pilot data.
High-leverage metrics to watch between iterations: redemption rate, cost-per-lead, uplift versus holdout group, and repeat purchase rate among print-originated customers. Analytics-driven campaign planning consistently improves ROI across channels, and print is no exception — see how analytics drives better ROI for a broader cross-channel perspective.
Which tools do you need to track a print campaign?
You need three tool types: a dynamic QR and PURL provider, an analytics platform that accepts UTM and event data, and a CRM that can store campaign source fields. The critical selection criterion is code longevity — a QR code printed on 10,000 flyers must remain active for the life of the campaign, regardless of billing changes.
Selection criteria for your QR and tracking provider:
- Dynamic redirecting so you can update the destination URL after printing
- UTM parameter pass-through to preserve attribution in GA4
- Scan heat maps to show geographic and temporal response patterns
- GDPR-compliant data handling with documented data residency
- Exportable reports (CSV) for finance and board presentations
- API access for CRM integration and automation
Qrlytics meets all six criteria. Its QR codes with analytics platform offers dynamic redirects, real-time scan data, global heat maps, and GDPR-compliant tracking. Codes created during an active subscription remain functional permanently, which matters when printed materials stay in circulation for months or years. A free tier is available with no credit card required, making it practical to run a pilot before committing to a full subscription.
Beyond QR, you will also want a call-tracking provider for phone-response campaigns, a coupon management tool integrated with your e-commerce platform, and CRM connectors to link print-originated leads to revenue.
The case for measuring print: an editorial view
Print without measurement is a cost centre. Print with measurement is a performance channel. The shift is not about technology — it is about deciding, before the job goes to press, that every piece will be accountable. Once you make that decision, the tools are straightforward: a dynamic QR code, a UTM-tagged landing page, a CRM field. The data that comes back is the same quality as any paid digital channel. Run one small tracked pilot, bring the ROI calculation to your next finance review, and the conversation about print budgets changes permanently.
Qrlytics makes your print campaigns measurable from day one
Print campaigns that use Qrlytics get a concrete measurement advantage: dynamic QR codes that update destinations without reprinting, real-time scan analytics, and global heat maps that show where and when your audience responds.
Key features for tracked print campaigns:
- Permanent code functionality — codes stay active regardless of billing status, protecting printed materials already in circulation.
- UTM support and CSV export — every scan carries campaign parameters through to GA4, and data exports in one click for finance reporting.
- GDPR-compliant tracking — data residency and retention controls built in, aligned with UK ICO guidance.
- Free tier, no credit card — generate your first tracked QR code and run a pilot campaign at no cost.
Create your first free tracked QR code and have a measurable print asset ready before your next campaign brief.
Sources
These resources support implementation planning, measurement templates, and procurement briefs for tracked print campaigns in the UK.
- Using mail to get the best from digital | Marketreach (Royal Mail)
- How to measure the ROI of print marketing campaigns | NonStop Marketing
- Measuring print campaign ROI with VDP | Print Lord
- ROI from print: how to measure return on printed materials | drukarniapro
- KPIs for evaluating print marketing campaigns | NEXUScpp
FAQ
Why do print campaigns need analytics?
Without analytics, you cannot attribute revenue to a print campaign or justify the spend to finance. Measurement turns print from a cost assumption into a performance channel with defendable ROI.
What is the simplest way to track a print campaign?
Add a dynamic QR code with UTM parameters pointing to a campaign-specific landing page. Every scan is recorded in GA4 with the correct campaign source, giving you visit and conversion data with minimal setup.
How do you calculate ROI for a direct mail campaign?
Use the formula: (attributed revenue − total campaign cost) ÷ total campaign cost. Attributed revenue comes from tracked conversions via QR codes, coupon redemptions, or PURLs, with a conservative addition for lagged responses.
What response rate should I expect from direct mail?
NEXUScpp gives directional benchmarks of 2–5% for cold prospect lists, with house lists typically performing higher. Treat these as a planning reference, not a guarantee.
Does Qrlytics support GDPR-compliant QR tracking?
Yes. Qrlytics includes GDPR-compliant tracking controls with documented data residency and retention settings, aligned with UK ICO requirements for direct marketing data handling.