Printed material tracking: How to master QR code campaigns

TL;DR:
- Print marketing remains costly, but without proper tracking, determining its effectiveness is challenging. Using dynamic QR codes, analytics, and optimized landing pages enables precise measurement of print campaign performance, boosting ROI. Establishing discipline through unique codes, post-campaign review, and quality design ensures successful print tracking and ongoing marketing improvement.
Print marketing still commands serious budget in most organisations, yet a surprising number of campaigns end with no clear picture of what worked. Flyers get distributed, brochures land on desks, and posters go up in windows, but without proper tracking, all you have is a rough estimate and a hunch. Combined digital and direct mail boosts ROI by 60% and response rates by 63%, which tells you the opportunity is real. This guide walks you through every stage of setting up printed material tracking using QR codes, so you can finally measure what your print spend actually delivers.
Table of Contents
- What you need for effective printed material tracking
- Step-by-step: Setting up QR code tracking for print campaigns
- Troubleshooting and optimising your printed material tracking
- What results to expect and how to measure success
- Why most print tracking fails—and how to get it right
- Next steps: Master QR code campaign tracking with QRlytics
- Frequently asked questions
Key Takeaways
| Point | Details |
|---|---|
| QR tracking maximises print ROI | Effective tracking ensures you know exactly which campaigns drive results and optimise spend. |
| Preparation is key for success | Gathering the right tools and testing codes before printing prevents costly mistakes. |
| Personalisation delivers higher response | Personalised and channel-specific QR codes can dramatically increase engagement rates. |
| Measure and adjust campaigns | Ongoing analytics let you adapt your print marketing for even better future performance. |
What you need for effective printed material tracking
Now that you know why printed material tracking matters, let’s look at what you actually need to get started.
Before you print a single sheet, you need the right building blocks in place. Rushing into print without a tracking infrastructure is one of the most common and costly mistakes marketers make. The good news is that the toolkit is straightforward once you know what each component does.
Here is what you need:
- A dynamic QR code generator. This creates codes that can be edited after printing, so you can update the destination URL without reprinting anything. Tools built for graphic designers often include branding options to keep codes on-brand.
- Analytics software. You need a platform that records every scan, including the time, location, and device. Without this, you are flying blind.
- Print-ready artwork. Your design files must accommodate the QR code at the correct size and contrast. If you work in Canva, look for solutions built specifically for QR codes for Canva designs to keep your workflow smooth.
- Unique campaign URLs. Each printed piece, or at minimum each channel, should have its own destination URL or UTM parameters so you can separate results cleanly.
- Mobile-optimised landing pages. If the page a user lands on is slow or hard to read on a phone, your scan data will look fine but your conversions will suffer.
| Tool | Function | Why it matters |
|---|---|---|
| Dynamic QR code generator | Creates editable, trackable codes | Avoids costly reprints if URLs change |
| Analytics platform | Records scan data in real time | Gives you attribution and performance data |
| UTM parameters | Tags traffic by source and campaign | Separates print traffic in your analytics |
| Print-ready design files | Ensures correct size and contrast | Prevents unreadable codes in the final print |
| Mobile-optimised landing page | Converts scanners into customers | Keeps bounce rates low after the scan |
Good design is not optional here. Best practices call for a minimum size of 2cm x 2cm with a quiet zone around the code, high contrast between the code and background, and landing pages that load in under three seconds. Cutting corners on any of these will hurt your scan rates before your campaign even gets going.

Pro Tip: Always use dynamic QR codes rather than static ones. If you need to change the destination URL after print, a dynamic code lets you do that instantly. Static codes are locked at the point of creation, meaning any URL change requires a full reprint.
Step-by-step: Setting up QR code tracking for print campaigns
With your tools assembled, it’s time to set up your campaign for tracking. Here is exactly how to do it:
-
Define your campaign goal. Decide what action you want people to take after scanning. A product page visit, a form submission, a discount redemption? Your goal shapes everything else, from the landing page to the metrics you track.
-
Create unique URLs for each channel. If you are running posters, flyers, and a direct mail piece simultaneously, each one needs its own URL or UTM parameter string. This is the only way to know which channel is driving results.
-
Generate your QR codes. Use a platform that supports QR codes for Adobe Express or your preferred design tool. Make sure each code links to its unique URL and is generated at a high resolution suitable for print.
-
Customise the code design. Add your brand colours, logo, or a call-to-action label beneath the code such as “Scan for 20% off.” Branded codes tend to earn more trust and higher scan rates than plain black-and-white squares.
-
Integrate into your print artwork. Place the code in a prominent position with sufficient quiet zone. Avoid placing it on dark or textured backgrounds that reduce contrast.
-
Test on multiple devices before printing. Scan the proof on at least three different smartphones using both the native camera app and a dedicated QR scanner. Best practice is to test pre-print on multiple devices to catch any issues before thousands of copies are produced.
-
Set up your analytics dashboard. Connect your QR codes to your analytics platform so that every scan is logged. Learn how to track QR code scans properly, including device type, location, and time of scan.
-
Deploy and monitor. Once printed materials are distributed, check your dashboard regularly. Early data will tell you if something is broken, such as a landing page that is down or a code that was printed too small to scan reliably.
| Feature | Static QR code | Dynamic QR code |
|---|---|---|
| URL editable after print | No | Yes |
| Scan data tracking | Limited or none | Full real-time analytics |
| Best use case | One-off, low-stakes print | Ongoing campaigns, print runs |
| Reprint required to change URL | Yes | No |
| Branding options | Basic | Advanced |
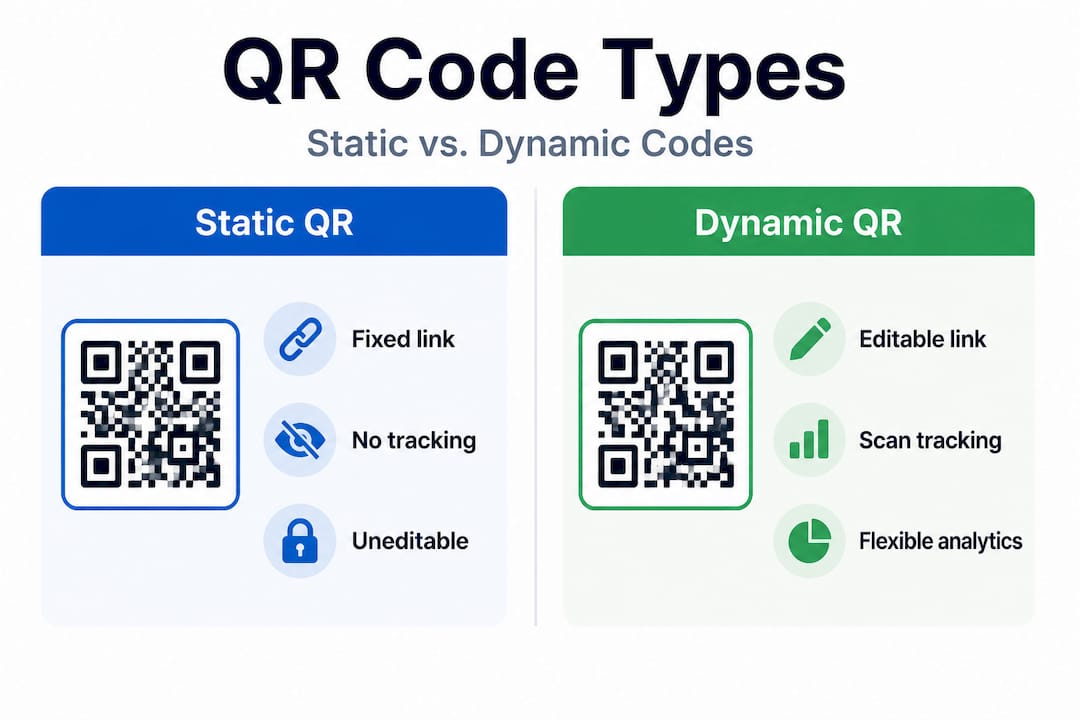
For QR codes for marketing, dynamic codes are almost always the right choice. The ability to update the destination without reprinting protects your investment in print production.
Pro Tip: Test your QR codes on several mobile devices, including older models with smaller screens and slower processors. If the code scans reliably on a three-year-old budget smartphone, it will work for virtually everyone in your audience.
Troubleshooting and optimising your printed material tracking
Even with a solid setup, tracking printed material can go awry. Here is how to keep performance on target and deal with obstacles.
The most common issues fall into three categories: codes that do not scan, landing pages that do not convert, and analytics that do not attribute correctly. Each one has a clear fix.
Common problems and solutions:
- Unreadable QR codes. Usually caused by printing too small, low contrast, or a damaged quiet zone. Fix: enforce the 2cm x 2cm minimum, use a white background, and leave clear space around the code.
- Slow landing pages. A page that takes more than three seconds to load will lose a significant portion of your scanners before they even see your offer. Fix: compress images, use a reliable hosting provider, and test load speed on a mobile connection.
- Failed attribution. If your UTM parameters are missing or incorrectly formatted, scans will show up as direct traffic in your analytics rather than being attributed to your print campaign. Fix: use a UTM builder to generate consistent, correctly formatted URLs and test them before printing.
- Low scan rates. Often a placement or CTA problem rather than a technical one. If your code is buried at the bottom of a page with no explanation, people will ignore it. Fix: add a clear benefit-led CTA such as “Scan to claim your free sample” and place the code at eye level.
- No post-campaign review. Many teams track scans during the campaign but never sit down to analyse the data afterwards. This means the same mistakes get repeated in the next campaign.
Real campaign benchmark: A personalised direct mail campaign sent to 300 lapsed customers achieved a 15% QR scan rate, a 14% response rate, and a 693% ROI. This is what happens when personalisation, clear CTAs, and proper tracking come together.
That figure is not typical for a generic mass-mail piece, but it shows what is possible when you treat print as a precision tool rather than a broadcast medium. The average QR scan-to-action conversion sits at 2 to 5%, so any campaign outperforming that benchmark is worth analysing closely to understand why.
If you want to find the best free QR code generator with tracking to get started without upfront cost, look for one that supports dynamic codes and real-time analytics from day one.
Pro Tip: Layer QR codes with personalisation and unique UTM parameters for each channel or audience segment. This gives you channel-level insights that show exactly which printed piece drove which result, making your next campaign sharper and more cost-efficient.
What results to expect and how to measure success
Once your campaign is running, knowing what good looks like is crucial. Here is how to track and interpret your results.
Results vary significantly depending on your industry, audience, and the quality of your offer. But having benchmarks gives you a realistic starting point and helps you identify when something is genuinely underperforming.
| Metric | Typical benchmark | Strong performance |
|---|---|---|
| QR scan rate (trade publications) | 0.8 to 2% | Above 3% |
| QR scan-to-action conversion | 2 to 5% | Above 7% |
| Direct mail engagement (personalised) | 10 to 15% | Above 15% |
| Combined print and digital ROI uplift | 60% | Above 80% |
| Response rate uplift (combined channels) | 63% | Above 75% |
Metrics to monitor throughout your campaign:
- Total scans. The raw number tells you reach. A sudden drop mid-campaign can indicate a technical issue.
- Unique scans vs repeat scans. Repeat scans suggest high interest or confusion about the destination. Both are worth investigating.
- Scan location. If you distributed materials across multiple cities or venues, location data tells you which area responded best.
- Device type. Knowing whether your audience uses iOS or Android helps you optimise your landing page for the dominant platform.
- Time of scan. Understanding when people scan, morning commute, lunchtime, or evening, helps you plan future distribution timing.
- Conversion rate. Scans are only the start. Track how many scanners complete the desired action on your landing page.
- Channel comparison. If you used unique codes per channel, compare scan rates and conversions across flyers, posters, and direct mail to find your most effective format.
Use your QR code tracking analytics platform to view all of this in one place. A dashboard that consolidates scan data, location heat maps, and conversion figures saves significant time and makes it far easier to spot trends.
Standout figure: Personalised direct mail campaigns can achieve 10 to 15% engagement, which is considerably higher than most digital display advertising benchmarks. Print, done properly, is not a declining channel. It is an underutilised one.
Why most print tracking fails—and how to get it right
After exploring the tools and steps, it is worth confronting why so many print tracking efforts still disappoint in practice.
The honest answer is rarely about technology. Most businesses have access to perfectly capable QR code generators and analytics platforms. The failure happens in execution, specifically in three recurring patterns.
First, teams use a single QR code across every printed format. One code for the poster, the flyer, and the direct mail piece. This feels efficient, but it destroys your ability to attribute results. You end up with a total scan count and nothing else. You cannot tell whether your poster drove ten times more engagement than your flyer, or whether your direct mail piece was completely ignored. Without that data, your next campaign is just as much of a guess as your last one.
Second, the post-campaign review never happens. Scans are logged, the campaign ends, and the team moves on to the next project. The data sits in a dashboard, unread. This is where the real value of marketing ROI tracking is lost. A 30-minute review session after each campaign, comparing scan rates, conversion rates, and channel performance, is worth more than any new tool or tactic. It tells you what to repeat and what to cut.
Third, businesses underestimate the importance of the destination. A well-designed QR code on a beautifully printed flyer means nothing if the landing page is slow, confusing, or not built for mobile. The scan is just the handover point. What happens next determines whether the campaign succeeds.
The fix for all three is discipline, not technology. Use unique codes per channel, review your data after every campaign, and treat the landing page as part of the print campaign, not a separate digital concern. Businesses that build these habits consistently outperform those chasing the latest tool.
Next steps: Master QR code campaign tracking with QRlytics
With all the fundamentals in place, the right tools can help you quickly scale and sharpen your print marketing.
QRlytics is built specifically for businesses and marketers who need reliable, long-term QR code tracking. Unlike free tools that deactivate codes when subscriptions lapse, QRlytics guarantees that every code created during an active subscription remains functional permanently. That matters enormously when your codes are printed on thousands of brochures or point-of-sale materials.
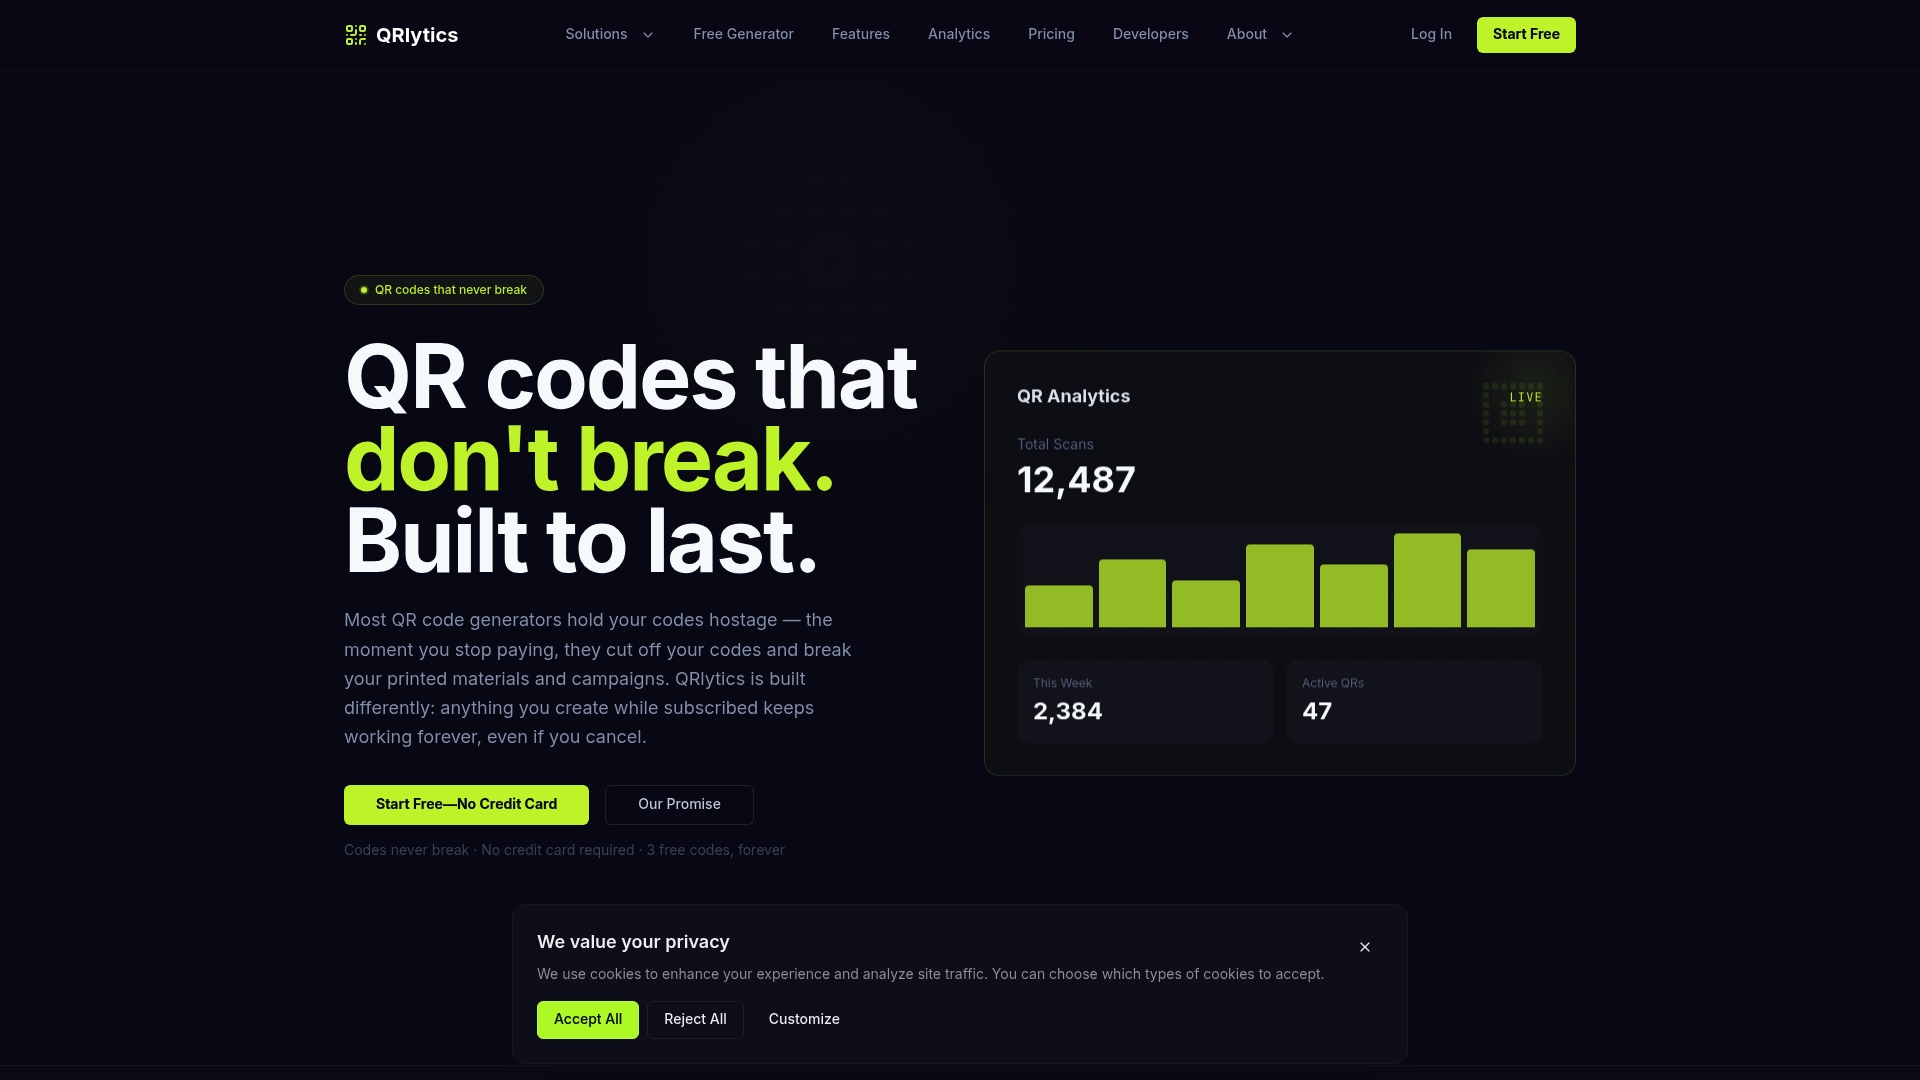
You can get started with a free QR code generator and no credit card required. When you are ready to scale, the dynamic QR code generator lets you update destination URLs instantly, run A/B tests, and manage multiple campaigns from one place. Your QR code tracking dashboard gives you real-time scan data, location heat maps, device breakdowns, and conversion tracking, everything you need to turn printed materials into a measurable marketing channel.
Frequently asked questions
What is the minimum size for a printed QR code?
At least 2cm x 2cm with a quiet zone around the edges is recommended for reliable scanning on most devices. Smaller codes risk being unreadable, particularly on lower-quality print finishes.
What scan rate should I expect from printed QR codes?
Average campaigns see a 2 to 5% scan-to-action conversion rate, but personalised direct mail can yield up to 15% engagement when the offer and audience are well-matched.
How can I track different channels using print?
Generate unique QR codes per channel or location so you can attribute results separately and compare performance across formats such as posters, flyers, and direct mail.
Why is personalisation important for printed campaigns?
Personalised direct mail can achieve a 693% ROI and a 15% QR scan rate, demonstrating that tailoring print to the individual significantly outperforms generic mass-distribution approaches.
Recommended
- QR Code Tracking — How to Track QR Code Scans & Measure Performance | QRlytics
- QR Codes for Graphic Designers — Verify Before Print | QRlytics
- QRlytics - QR Code Generator with Analytics & Tracking
- QR Codes for Marketing & Advertising | Track Campaign ROI | QRlytics
- How to Track Campaign Performance for Measurable Growth | Ibrandmedia
- Top Print Marketing Materials Trending in 2024: Elevate Your Brand’s Visibility