QR Scan Times by Time Zone: 3 Timestamps That Shape Campaign Reports

Most QR analytics platforms store scan events as UTC or server-received timestamps, then convert them for display based on your dashboard or account settings. Device location and device-reported time can refine the estimate when permissions allow it, but raw exports and APIs almost always default to UTC to keep the data unambiguous.
TL;DR:
- GPS or device location gives the strongest time zone estimate, but denied permissions leave platforms relying on device settings or IP data vulnerable to errors.
- Dashboards may convert timestamps to viewer, account, or campaign time, while raw CSV and API exports usually retain UTC, so comparisons require normalization.
- When timing gaps matter, choose a platform that stores the device timestamp alongside UTC, since server receipt can trail scans by seconds or longer.
- Use one reporting time zone, adjust daylight saving separately by region, and verify reports against five or six scans with known locations and times.
Table of Contents
- How platforms compute a scan’s time zone
- What timestamp actually gets recorded
- How dashboards convert and display scan times
- What this means for your reporting
- Security and privacy considerations for scan data
- How we handle time and permanence for long-running campaigns
- A quick audit checklist for timezone accuracy
- Try timezone-aware QR analytics with QRlytics
- FAQ
- Sources
How platforms compute a scan’s time zone
Working out where (and therefore when) a scan happened relies on a hierarchy of signals, not a single source. Each one carries trade-offs that affect how precise the time zone estimate ends up being.
- GPS or device location (when the scanner grants permission) gives the most accurate time zone, since it pinpoints the actual coordinates of the scan.
- Device locale and clock settings act as a fallback when location access is denied, though a misconfigured device clock or the wrong regional setting can throw off the result.
- IP geolocation estimates a rough location from the network address, but VPNs, mobile roaming and corporate proxies can place the scan hundreds of miles from where it actually happened.
- Delayed uploads, common on patchy mobile connections, mean the event sometimes reaches the server well after the physical scan, muddying any time zone inferred from arrival alone.
None of these signals is foolproof on its own, which is why most platforms blend them and lean on server-side normalisation as the dependable baseline.
What timestamp actually gets recorded
There are three candidate timestamps in play for any scan: the one the device reports, the one the server logs on arrival and a normalised UTC value derived from either. Knowing which one your platform stores changes how you should read the data.
- Device-supplied timestamp: taken from the scanning device’s own clock, useful for precision but only as reliable as that device’s settings.
- Server-received timestamp: logged the moment the request hits the backend, which is more consistent but can lag the real scan moment due to network latency.
- Normalised UTC timestamp: the canonical value most platforms store internally and expose through exports and APIs, avoiding the ambiguity of mixed local times.
Network round trips mean the server-received time is usually a few seconds (sometimes longer on weak connections) behind the actual scan. For campaigns where that gap matters, look for a platform that also captures a device-supplied timestamp alongside the normalised one.
How dashboards convert and display scan times
The timestamp stored behind the scenes is rarely what you see on screen. Dashboards apply a conversion layer so the numbers make sense to whoever is looking at them.
- Viewer local time: the dashboard detects your browser or account location and converts every timestamp to match.
- Account default time zone: a fixed zone you set once, so every report reads consistently regardless of who views it.
- Campaign-specific time zone: useful when a single campaign runs in one region, letting you lock reporting to that zone rather than your own.
Heat maps and time-of-day segments typically apply this same conversion, which is why a scan logged at 11pm UTC can appear as “6pm” in a dashboard set to a different zone. Raw CSV or API exports usually skip this step entirely and return the underlying UTC value, so a figure that matches the dashboard might look different the moment you open the export file.
What this means for your reporting
Time-of-day analysis only holds up if every scan is measured against the same clock. Mixing dashboard-converted figures with raw UTC exports is one of the fastest ways to misread a campaign’s performance.
- Pick one canonical time zone (the campaign’s own, or a single reporting standard) and convert every data point to it before comparing.
- Account for daylight saving changes separately for each region in a multi-timezone campaign, since clocks shift on different dates depending on location.
- Export in UTC and label it clearly, adding a column for the localised display time alongside the source (device or server) so anyone reviewing the sheet can audit it later.
- Run a QA check on a handful of scans with known locations before trusting an aggregate report.
Our guide to qr scan time-of-day data walks through this normalisation process in more depth, and if timing campaigns around audience behaviour is part of your strategy, Soclo’s piece on the best time to post is a useful companion read for thinking about scan timing alongside broader content scheduling.
Pro Tip: Keep a small spreadsheet of five or six test scans with known times and locations. Re-check it whenever you add a new region to a campaign.

Security and privacy considerations for scan data
QR codes carry real scam risk alongside the analytics upside. The FTC has warned that scammers hide harmful links inside QR codes to steal personal information, and a 2026 FTC consumer alert specifically flagged tampered codes in public spaces like parking meters. The FBI has documented fraud schemes involving unsolicited packages containing malicious codes, and separate FBI guidance notes that scanning an unverified code can lead to malware or financial loss.
- Preview the destination URL before following any unfamiliar QR code.
- Favour platforms that pseudonymise or hash IP addresses rather than storing raw identifiers, which supports GDPR and CCPA compliance.
- Keep device software updated and report suspicious codes rather than scanning them out of curiosity.
How we handle time and permanence for long-running campaigns
We built our analytics to give you a clear, exportable record of when and where every scan happens, without the guesswork that comes from mismatched time zones across a report. Every scan is logged with a normalised timestamp, and our dashboards let you view activity in the zone that matches your campaign rather than forcing everyone onto one default.
- Analytics can show scan activity, sometimes with location detail that feeds into heat maps.
- Exports give you the underlying timestamp data for your own audits and cross-team reporting.
- Some platforms offer codes that keep working after subscription changes, which matters for printed campaigns that run for months or years after the batch goes to print.
For setup details and export walkthroughs, our QR codes with analytics page covers the feature set end to end, and the QR code best practices guide is worth a read before your next print run. If you are weighing up signage placement as part of a multi-location rollout, Zoney’s guide to QR codes on digital signage covers scan context in physical spaces well.
A quick audit checklist for timezone accuracy
The most common mistake is trusting whatever the dashboard shows without ever checking the raw export behind it. Before you report a time-of-day trend to a client or a colleague, run through this in a few minutes: confirm your account and campaign time zone settings, pull a UTC export and compare it against the dashboard view, check whether a daylight saving shift falls inside your reporting window, and test one scan with a known location and time to see whether it lines up. If it does not, reach out to support rather than guessing at the gap.
— The
Try timezone-aware QR analytics with QRlytics
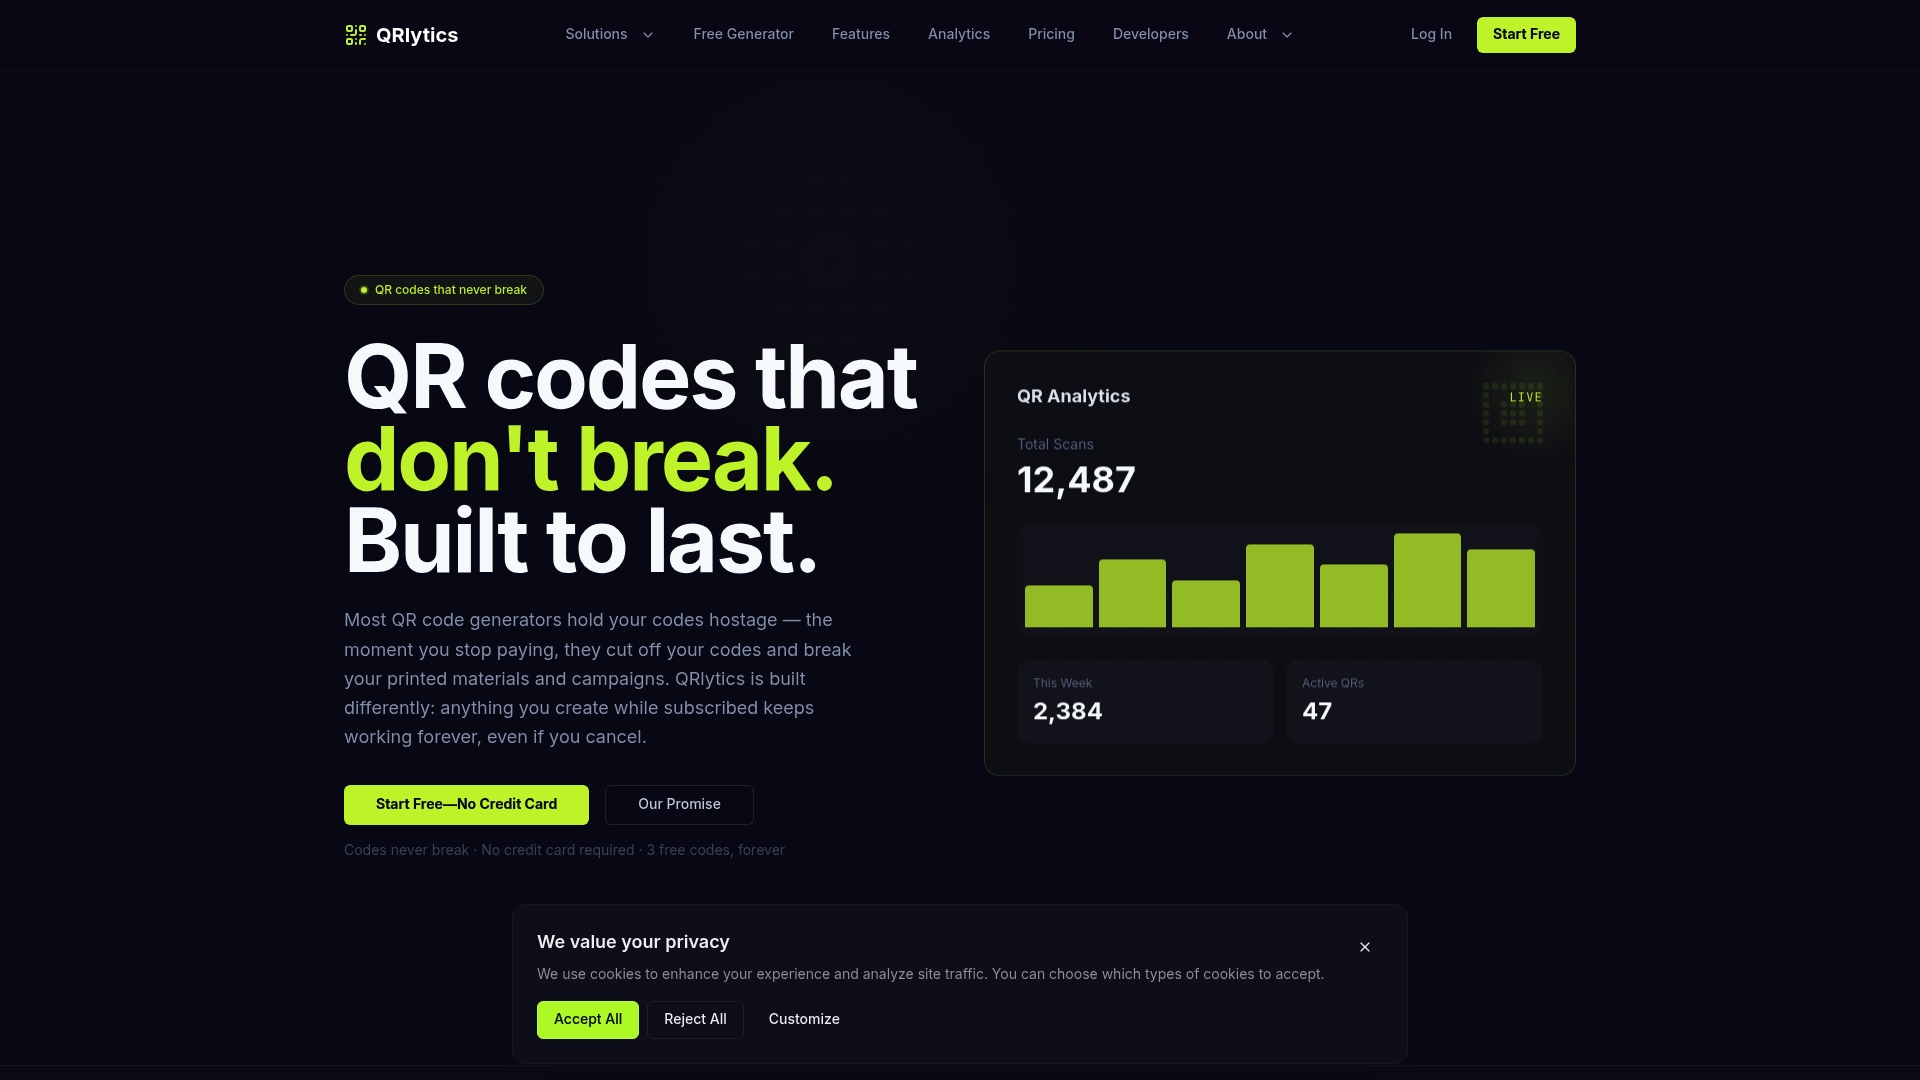
If you are tired of reconciling dashboard times against export files, or worse, watching a printed QR code stop working after a billing hiccup, we built QRlytics around solving exactly that. Every code created while your subscription is active keeps redirecting permanently, and our analytics give you timezone-aware reporting without extra configuration headaches.
- Some services allow you to sign up without a credit card and may provide real-time scan analytics from the first code created.
- Exporting raw timestamp data alongside dashboard views may be possible to support audits across regions.
- Move from our Free plan to Pro as your campaigns grow, with pricing details available on our plans page.
Start with a free dynamic QR code and see how the analytics hold up against your own timezone checks.
FAQ
What is the FBI warning about QR codes?
The FBI has warned that scammers use QR codes, including ones sent in unsolicited packages, to direct victims to malicious sites that install malware or steal financial information. Guidance from the FBI recommends avoiding unfamiliar codes and reporting suspicious activity to the IC3.
Is there a QR code time clock app available?
Time clock apps that use QR codes for staff check-ins exist as a separate category from QR analytics platforms, which focus on tracking scan activity rather than attendance logging. If timestamped attendance is your goal, look for software built specifically for workforce time tracking rather than general QR analytics.
How do I scan a QR code from far away?
Scanning distance depends mainly on your camera’s resolution and the printed size of the code, since a larger code can be read from further away. For reliable long-range scanning, print codes at a size proportional to the expected scanning distance and ensure adequate lighting and contrast.
Can you track how often a QR code is scanned?
Yes, dynamic QR codes paired with an analytics platform record every scan, including the time, approximate location and device type. Our QR code tracking tools log this automatically for every dynamic code you create.
Why does my scan data show in a different time zone than expected?
Dashboards typically convert stored timestamps to your viewer, account or campaign time zone for display, while raw exports and APIs usually return the underlying UTC value. Checking your account’s time zone setting and comparing it against a UTC export usually resolves the mismatch.
Sources
- Scammers hide harmful links in QR codes to steal your information | Consumer Advice
- Unsolicited packages containing QR codes used to initiate fraud schemes — FBI