QR code reporting for operations: analytics & tracking
QR code reporting captures every scan alongside a structured form response, so operations teams can log incidents, measure engagement and act on location-aware data without waiting for someone to type up a report. In practice, it works as scan logging combined with a linked digital form and a dashboard that turns raw scan events into usable numbers.
What you get from a working system:
- Scan counts — total and unique scans per code, per location, per time period
- Timestamps — exact date and time for every scan, useful for spotting patterns
- Location data — GPS coordinates or point-of-interest tags showing where scans happen
- Device and browser details — helps you understand how people are accessing your codes
- Form responses — the structured data someone submits after scanning (incident type, severity, photos)
- Exports and API access — raw data you can pull into spreadsheets, SIEM tools or your own systems
If you manage facilities, safety or field operations, the fastest way to see the value is to build one dynamic QR code linked to a simple incident form, place it near a real hazard or asset, and test the full loop from scan to dashboard entry before rolling out further.
Key Takeaways
QR code reporting works because it pairs a scan event with a structured form and a live dashboard, turning field observations into searchable, exportable operational data.
| Point | Details |
|---|---|
| Dynamic codes are essential | Static codes can’t be updated, making them unsuitable for incident reporting that evolves over time. |
| Watch submission rate first | A gap between scans and completed forms usually points to form friction, not lack of interest. |
| Minimise personal data | Collect only the location and issue details you need, and document a clear retention period. |
| Heatmaps guide placement | Enrich scans with POI tags to spot clusters and adjust code location or messaging accordingly. |
| Start small with QRlytics | QRlytics offers permanent dynamic codes, real-time analytics and heatmaps with no credit card required to begin. |
Table of Contents
- What is QR code reporting and how do issue QR codes work?
- What metrics should you track in QR code reporting?
- How do you set up QR code reporting for incident and issue tracking?
- How do you view and manage QR code analytics?
- What privacy and compliance rules apply to QR code reporting?
- How do heatmaps and POI data improve QR code placement?
- What are the most common use cases for QR code reporting?
- How do you choose the right QR code reporting solution?
- What actually determines whether QR code reporting succeeds?
- Why QRlytics fits an incident-reporting rollout
- Sources
- FAQ
What is QR code reporting and how do issue QR codes work?
QR code reporting is the practice of pairing a scan event with an optional linked form, then feeding both into a dashboard or export pipeline. Someone scans a code, lands on a form (often prefilled with the code’s location or asset ID), submits it, and that submission joins the scan data in a single record. The result is a live log of where, when and what was reported, rather than a paper trail that sits in someone’s pocket for three days.
The distinction that matters most here is static versus dynamic QR codes. A static code has its destination baked into the pattern itself. If you need to change the URL, you print a new code. A dynamic QR code points to a short redirect URL that you control from a dashboard, meaning you can update the destination, pause the code or extend its life without touching the printed material. For incident and issue reporting, dynamic codes are the only sensible choice: hazards get remediated, forms get revised, and campaigns end, but the physical sticker on a machine or wall often stays put for years.
Before you start, you’ll need four things in place:
- A form or incident template (even a simple one covering location, category, severity and description)
- A dynamic URL generator that supports prefilled parameters
- A dashboard or export destination where submissions land
- Defined permissions for who can view, edit or export the data
SafetyCulture’s documentation on issue QR codes shows a workflow many teams recognise: a scan opens a form without requiring an account, captures structured fields immediately, and routes the submission into an existing incident workflow. That’s the model worth copying, whether you build it yourself or use a dedicated platform. The flow itself is straightforward: scan, prefilled form or landing page, submission, ingestion into the dashboard, and, ideally, an alert to whoever owns that location or asset.
What metrics should you track in QR code reporting?
Scan volume alone tells you almost nothing useful. The metrics that matter for operations sit one layer deeper, in the combination of who scanned, when, where and what happened next.
Start with the core scan data: total scans, unique scans (to filter out repeat visits from the same device), scans broken down by date and time, geolocation down to coordinates or a named point of interest, device and operating system, referrer source, and any campaign or location tag you’ve attached to the code. On their own, these numbers describe traffic. Combined with event data, they describe behaviour.
Event and conversion metrics are where incident reporting earns its keep. That means form submission counts, incident severity flagged by the reporter, attachments uploaded (photos of damage, for instance), and any follow-up actions logged against the report. A code with high scan volume but low submission rate usually signals friction in the form itself, not disinterest from the people scanning it.
| Metric | What it measures | Why it matters for operations |
|---|---|---|
| Total scans | Every scan event, including repeats | Shows overall reach and code visibility |
| Unique scans | Distinct devices or sessions | Filters noise from repeat access, more reliable for footfall |
| Scans by time/date | Timestamp distribution | Reveals peak reporting windows and staffing needs |
| Geolocation | Coordinates or POI tags | Pinpoints where issues cluster physically |
| Device/OS | Hardware and software used | Flags accessibility issues on older devices |
| Submission rate | Scans that convert to a completed form | Diagnoses friction between scan and report |
| Severity distribution | Reported issue severity levels | Prioritises which locations need urgent attention |
Pro Tip: After launch, watch unique scans, submission rate and geographic clustering first. If submission rate is low but scans are healthy, the form is too long or asks for information the reporter doesn’t have to hand. Fix that before touching anything else.
How do you set up QR code reporting for incident and issue tracking?
Building an incident-reporting workflow with QR codes is a sequential process, not a one-off task. Skip a step and you end up with codes that scan fine but generate unusable data.
- Design the form first. Keep it short: location or asset ID, issue category, severity, free-text description, and an optional photo upload. Every extra field costs you completion rate.
- Create a dynamic QR code with a prefilled URL. Pass the location or asset ID as a URL parameter so the reporter doesn’t have to type it. Tools like QRlytics’s dynamic QR code generator let you set this up without a developer.
- Print and place the codes. Match material to environment, more on that below.
- Set permissions and notifications. Decide who sees submissions, who gets alerted, and how quickly.
- Test the entire loop end to end. Scan from at least two device types, confirm the form loads with correct prefill values, submit a test report, and verify it reaches the dashboard or API endpoint intact.
Placement is where a lot of otherwise well-designed programmes fall apart. A weatherproof label that fades in six weeks or peels off a greasy machine surface is worse than no code at all, because it creates a false sense that reporting infrastructure exists.
- Use laminated or weatherproof vinyl for outdoor or industrial placements
- Size the code so it’s scannable from typical distance (at least 3cm square for close-range, larger for anything scanned from more than a metre away)
- Maintain strong contrast between the code and its background; avoid printing on reflective or curved surfaces
- Place codes at eye level or hand height near the hazard or asset, not on a distant noticeboard
- Add a one-line instruction (“Scan to report an issue”) next to the code, since not everyone recognises QR codes as actionable
For time-limited deployments, such as a seasonal safety campaign or a temporary construction zone, schedule activation and expiry dates on the dynamic code rather than relying on someone to remember to deactivate it manually. Acceptance criteria before go-live should include: geolocation capture accurate to within a reasonable radius, prefill parameters arriving correctly in the form, and the submission payload landing in the dashboard or API with no dropped fields.
How do you view and manage QR code analytics?
A dashboard earns its keep the moment someone in operations can answer “where are our problems clustering?” without exporting anything to a spreadsheet first. Most platforms, including commercial QR tracking tools reviewed by Human Service Solutions, converge on a similar feature set: a live scan feed, time-series trend charts, and filters by code, campaign, location and device.
The features that matter most for day-to-day management include:
- Live scan feed — see submissions arrive in real time rather than checking back hourly
- Filters by location, campaign or device — isolate one site or asset type without wading through everything else
- Unique versus total scan views — toggle between raw volume and deduplicated activity
- Conversion funnels — track the drop-off between scan and completed submission
- CSV and XLSX export — pull raw data for deeper analysis or archival
- API access — feed scan and submission data directly into SIEM, incident management or business intelligence tools
- Heatmap and POI overlays — visualise where activity concentrates geographically
Real-time data feeds matter more for incident reporting than for most marketing use cases, because a delayed alert on a genuine safety issue defeats the purpose of the system. Configure a dedicated “incidents” view separate from general campaign tracking, and set automatic alerts for low submission rates at a given location (a signal the code might be damaged or hidden) or unusual geographic clustering (a signal of a recurring physical problem worth investigating on-site).
Export completeness deserves particular attention during setup. If your dashboard drops attachment metadata or timestamps during CSV export, you’ll only discover it the day someone needs that evidence for an audit.
What privacy and compliance rules apply to QR code reporting?
Collecting scan and location data responsibly means minimising what you gather, not maximising it. Most incident-reporting use cases don’t need to identify the individual reporter at all, only the location, timestamp and issue details, so avoid capturing personally identifiable information unless your workflow genuinely requires it. Where you do collect names or contact details for follow-up, document a retention period and stick to it.
Practical controls worth putting in place:
- Anonymise or aggregate location data where individual-level precision isn’t operationally necessary
- Document a clear retention policy and delete records once that window closes
- Secure dynamic URL endpoints against tampering, and apply rate limits to prevent scraping or spam submissions
- Require authentication for dashboard and API access, with role-based permissions for who can view versus export data
- Protect uploaded attachments (photos, documents) with the same access controls as the rest of the submission
- Review data privacy practices for QR campaigns before scaling beyond a pilot
Regulatory context reinforces why this matters beyond good practice. OSHA’s enforcement directives underscore that safety-related reporting programmes need robust evidence capture and retention, since incident records may need to withstand audit or inspection scrutiny well after the original event. A QR-based reporting system that can’t produce a clean, timestamped export when asked isn’t fit for regulated environments, however slick its dashboard looks day to day.
This is general information rather than legal advice. Confirm specific retention and consent obligations with your compliance team or legal counsel, since requirements vary by jurisdiction and industry.
How do heatmaps and POI data improve QR code placement?
Combining scan events with point-of-interest tags turns a flat list of coordinates into a map you can actually act on. The method is simple enough for most operations teams to run without a data science background: enrich each scan with a POI tag (transit hub, retail entrance, loading dock, residential zone), bucket scans into time-of-day histograms, then plot the results as a heatmap to spot clusters. Teams with larger datasets sometimes apply clustering techniques like K-Means to formalise the groupings, but visual inspection of a heatmap often reveals the same patterns just as clearly.

Research backs up why this enrichment step is worth the effort. A Scientific Reports study analysing over 134,000 scan records from 2023 found consistent spatial clusters tied to transport nodes and commercial centres, with lunchtime emerging as a common peak across brands, alongside secondary peaks that varied by context. Separate research on the spatial determinants of QR scanning behaviour found that surrounding transport networks and land use strongly shape where scans concentrate, and recommends comparing heatmaps across different placements rather than assuming one location’s pattern applies everywhere.
For an operations team, the practical takeaway is to treat placement as a variable, not a fixed decision. If your heatmap shows an incident-reporting code near a transit hub generating heavy scan volume but low submission completion, the problem might be that people are scanning while walking and abandoning the form, not that the location is wrong. A code at a quieter loading dock with lower volume but a high completion rate may be doing its job better.
| Step | Action | Output |
|---|---|---|
| 1. Enrich | Tag each scan event with a POI category | Location context beyond raw coordinates |
| 2. Bucket | Group scans into time-of-day and day-of-week windows | Temporal peak identification |
| 3. Map | Plot enriched scans as a heatmap | Visual cluster identification |
| 4. Compare | Contrast heatmaps across different placements | Evidence for relocating or redesigning codes |
| 5. Act | Adjust placement, signage or CTA based on clusters | Improved submission rates and coverage |
If you want a deeper walkthrough of interpreting these patterns, QRlytics’s guide to heatmaps in QR analytics and its companion piece on geo-targeted QR marketing both cover the practical side of turning location data into placement decisions. For teams applying similar spatial thinking to retail environments specifically, BizDev Strategy’s examples of shopper behaviour analytics offer useful comparative context.
What are the most common use cases for QR code reporting?
QR code reporting shows up across a wider range of operational contexts than most people expect on first encounter.
- EHS incident reporting — workers scan a code near a hazard to log safety concerns immediately, with photos and severity ratings attached
- Asset condition checks — maintenance teams scan equipment to log wear, faults or service history at the point of inspection
- Facility fault reporting — building occupants report broken fixtures, leaks or access issues without needing a helpdesk number
- Cleaning and maintenance verification — staff scan on completion of a task, creating a timestamped audit trail
- Marketing-to-operations handover — a customer-facing campaign QR code doubles as a feedback or fault-reporting channel post-purchase
A mid-sized facilities team managing several warehouse sites illustrates the pattern well. Before deploying QR reporting, maintenance issues were logged through a shared email inbox, which meant delays between an issue being spotted and a technician being dispatched, often measured in days rather than hours. After placing dynamic QR codes at key equipment points, feeding into a structured form with severity tagging, average time between report and first response dropped noticeably, and the team gained a searchable history of recurring faults per machine, something the email inbox never provided.
Expected KPIs differ by use case. For EHS reporting, track submission rate and mean time to resolution. For asset checks, track completion frequency against a maintenance schedule and repeat-fault rate per unit. For facility faults, track time from report to acknowledgement, since occupants judge the system by responsiveness more than by anything else.
How do you choose the right QR code reporting solution?
Selecting a platform comes down to matching capability against how your team actually plans to use the data, not chasing the longest feature list.
Run your evaluation against these criteria:
- Metrics tracked — confirm scans, unique scans, location, device, timestamp and event conversions are all captured natively, not bolted on later
- Dynamic-code capability — editable destinations are non-negotiable for anything printed and left in the field for more than a few weeks
- Privacy and retention controls — check for configurable retention windows and role-based access before committing
- API and export features — CSV export covers basic reporting; API access matters if you need to feed data into a SIEM, IMS or business intelligence tool
- Heatmap and POI support — useful for any deployment spanning multiple physical locations
- Reliability and uptime — a reporting system that goes down during an actual incident is worse than no system
- Cost and licensing model — weigh subscription tiers against how many codes and how much data volume your operation genuinely needs
Setup complexity varies by criterion. Dynamic codes and prefill parameters are typically low effort to configure through a dashboard. API integration with an existing SIEM or IMS platform is medium to high effort, usually requiring a developer for the initial connection. Printing and physical placement logistics sit at medium complexity, mostly a matter of planning rather than technical difficulty.
During any trial, test scan logging fidelity across multiple devices, verify geolocation accuracy against known coordinates, confirm prefill parameters populate correctly, check API reliability under a reasonable load, and pull a full export to make sure no fields are silently dropped. Self-hosted dynamic QR projects demonstrate that the core feature set, geo and device logging, editable destinations, export capability, has become close to a baseline expectation rather than a premium add-on, and production-grade implementations typically add scheduling, access controls and richer export formats on top of that baseline. Measured against this checklist, QRlytics covers the criteria that matter most for operational reporting: dynamic codes with permanent functionality, real-time analytics, heatmap and API access, and GDPR-compliant tracking built in from the start.
What actually determines whether QR code reporting succeeds?
Most guides to this topic focus on features. The bigger determinant of success, in our experience analysing how these systems get adopted, is scope discipline at launch. Teams that try to roll out QR reporting across every location and every issue type simultaneously tend to generate a flood of low-quality data nobody has time to act on. Teams that start with one location and one issue type build a habit, prove the workflow, and only then expand.
The second pitfall is treating the dashboard as the finish line. A heatmap that nobody reviews is decoration. Build the review into someone’s actual job, a weekly fifteen-minute check of submission rates and location clusters, before you scale to a second site.
A few practical starting points:
- Start with a single asset or location rather than a full rollout
- Enable exports and alerts from day one, even if nobody’s using them yet
- Review the heatmap after two weeks, not two months, so you can course-correct placement early
- Treat low submission rate as a signal to check the physical code, not just the form design
If you’re ready to test this on a real location, the promo section below covers a practical starting point.
Why QRlytics fits an incident-reporting rollout
Codes that stop working the moment a subscription lapses have quietly ruined more printed safety signage and asset labels than most facilities managers care to admit. QRlytics guarantees that any code created during an active subscription keeps working permanently, so a laminated code bolted to a piece of machinery two years ago still redirects correctly today, regardless of billing changes in between.
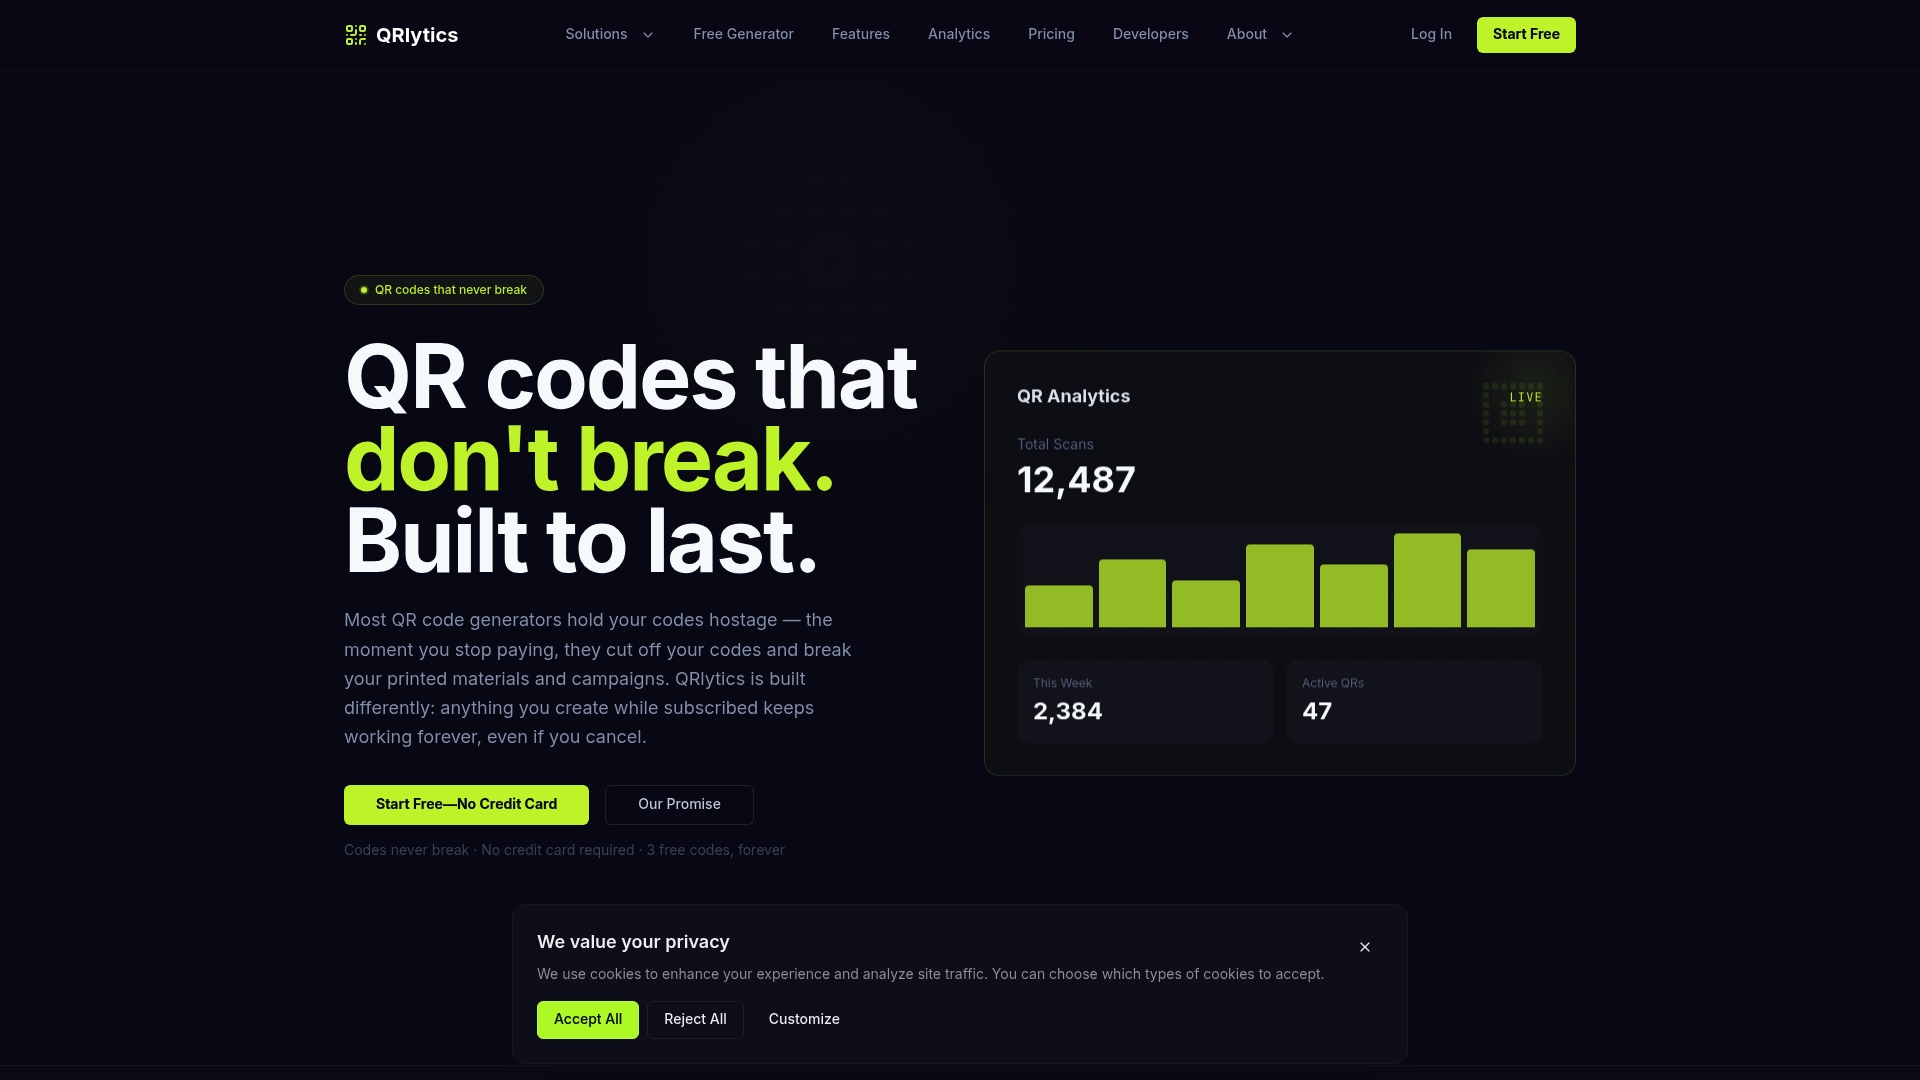
Beyond permanence, the platform gives you the specific pieces this guide has walked through: dynamic URLs you can edit without reprinting anything, real-time scan analytics with geolocation and device data, heatmaps for spotting clusters across multiple sites, API access for feeding submissions into your own systems, and GDPR-compliant tracking built in rather than bolted on. Onboarding requires no credit card, so you can create a free dynamic QR code today, link it to a test incident form, place it somewhere real, and watch the first scans land in your dashboard before deciding whether to expand the pilot.
Sources
- Spatiotemporal analysis of consumer scanning behavior using integrated QR code and POI data | Scientific Reports
- PubMed indexed research on spatial determinants of QR scanning behaviour
- OSHA enforcement directives
FAQ
How do you report an issue using a QR code?
Scan the code with a phone camera, which opens a form or landing page, often prefilled with the location or asset ID, then fill in the remaining details and submit. The submission typically routes straight into a dashboard or incident workflow within seconds.
Can someone get your information from a QR code?
A QR code itself only stores the destination URL or data encoded into it. Whatever happens after scanning, such as a form asking for your name or location, is where personal information gets collected, and that depends entirely on how the destination is built and what it requests.
Can I see how many people scanned my QR code?
Yes, if you’re using a dynamic QR code linked to an analytics dashboard, you can see total scans, unique scans, and breakdowns by time, location and device. Static codes with no tracking layer offer no scan visibility at all.
How do you scan a QR code to submit a report?
Open your phone’s camera app or a QR scanning app, point it at the code until it’s recognised, then tap the link that appears to open the connected form or page. Most modern smartphones handle this natively without needing a separate scanner app.