Marketers: Avoid Reprinting 10,000 Units With Print QR Analytics
Print QR analytics means tracking who scans a printed code, when, where and on what device, using a dynamic redirect rather than a static link. The one action that makes this possible: generate a dynamic QR code for every placement, append UTM parameters to the destination URL before you print, and connect the results to a dashboard or GA4. Skip that step, and your printed campaign stays invisible.
TL;DR:
- Dynamic QR codes are essential for tracking scans because they route through a controlled redirect that logs timestamp, location, and device data.
- Adding UTMs to destination URLs before printing ensures accurate campaign attribution, as QR code destinations are fixed at print time.
- Comparing total scans with unique visitors, normalized by exposure, reveals true reach versus repeated scans or low engagement.
- Regularly exporting and analyzing scan data helps identify underperforming placements and optimize future campaigns.
- Static codes are suitable only when permanence outweighs measurement, while most marketing campaigns benefit from the flexibility and data capabilities of dynamic codes.
Table of Contents
- How print QR analytics actually works
- Key metrics that tell you whether print is working
- Dynamic vs static QR codes: the trade-off print marketers actually face
- Step-by-step: setting up print QR analytics that actually works
- Best practices and the mistakes that quietly wreck your data
- How Qrlytics approaches reliable print QR analytics
- Why treating print as measurable changes how marketers behave
- Get your print campaigns measurable with Qrlytics
- Sources
- FAQ
How print QR analytics actually works
A QR code doesn’t track anything by itself. It’s a pattern that stores a piece of text, usually a web address. The tracking happens at the redirect, the short link the code points to, which logs the scan before sending the visitor on to the real destination.
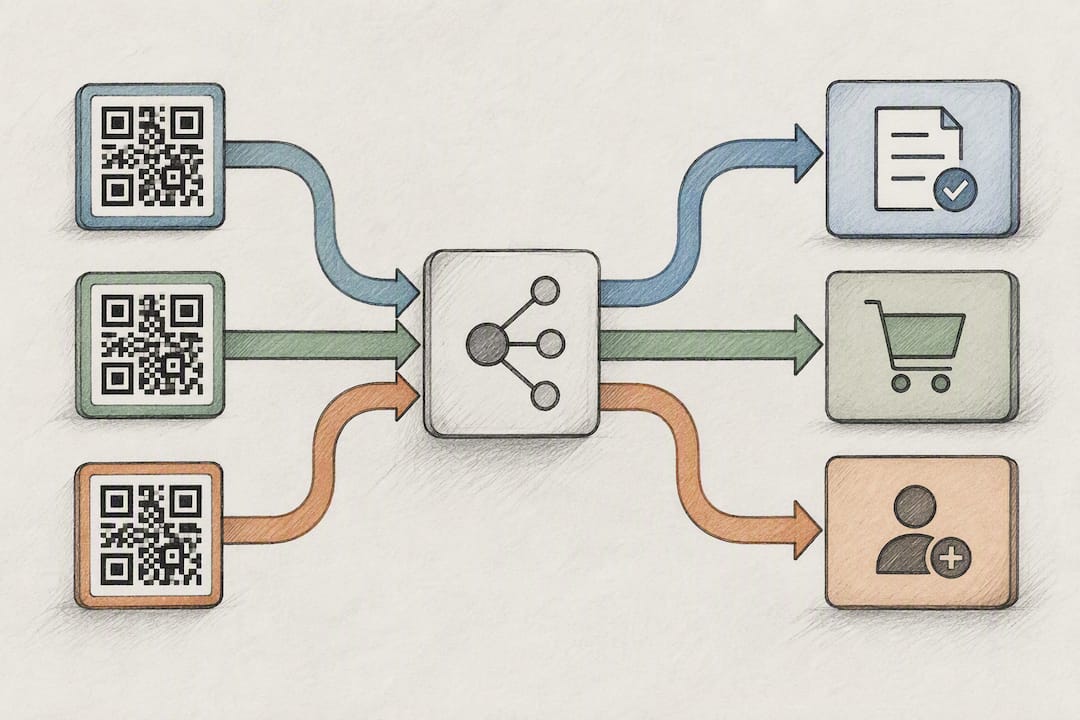
That single distinction, between a code that points straight at a destination and one that points at a redirect, decides whether you’ll ever see a number. A static QR code encodes the final URL directly. Nobody’s server sees that scan happen because there’s nothing in between the phone camera and the destination page. A dynamic QR code encodes a short link that a platform controls. Every scan passes through that link first, so the platform can record it, then forward the visitor without any noticeable delay.
This is why “how do I track analytics from a QR code” almost always has the same answer: switch to dynamic, or you’re not tracking anything at all. According to EZQR’s documentation on scan tracking, the redirect step is what captures timestamp, approximate location, device type, and referrer information, the raw material every campaign report is built from.
There’s a second, easily missed requirement. UTM parameters, the small tags added to the end of a URL such as utm_source=poster, need to sit on the destination URL before you generate the code and send it to print. A QR code is a fixed snapshot of whatever URL it held at creation. You cannot retroactively tag scans that already happened.
What a decent vendor dashboard or GA4 property typically captures once this is set up:
- Scan timestamp and time zone
- Approximate location (city or region level)
- Device type and operating system
- Referrer or app source, where the scan originated
Get the redirect and the UTMs right before printing, and everything downstream, GA4 reports, exports, dashboards, becomes possible. Get it wrong, and no amount of clever reporting afterwards will fix it.
Key metrics that tell you whether print is working
Raw scan counts feel satisfying but tell you almost nothing on their own. The metrics that actually inform decisions are the ones that compare, normalise, or connect to an outcome.
Total scans versus unique scans is the first split worth watching. A poster showing 400 total scans from 60 unique visitors isn’t reaching 400 people, it’s being rescanned repeatedly by a much smaller group, often staff or the same passer-by checking twice. That gap between total and unique tells you whether reach or repetition is driving the number.
Scans normalised by exposure matters more than raw volume when comparing placements. A shop-window sticker up for 90 days and a flyer handed out for a single weekend event will naturally produce very different totals; dividing scans by days in market (or estimated footfall) is the only fair way to compare them.
Beyond those two, the metrics worth checking regularly include:
- Geography, city or country level, showing where physical distribution actually converts to interest
- Time-of-day and day-of-week patterns, which reveal whether a billboard performs during commute hours or evenings
- Device and OS split, useful for confirming your landing page renders properly where scans actually happen
- Referrer and preview indicators, which flag traffic that never came from a genuine human scan
On that last point, QRStuff’s platform data shows a persistent measurement gap across the industry: only a small share of QR destinations carry visible campaign tracking parameters at the point of creation. That single detail explains why so many marketers can report “scans happened” but can’t say what those scans led to.
Conversion mapping closes that gap. Route scans to a landing page instrumented with its own event or pixel, form submission, purchase confirmation, newsletter signup, and you can join the scan log to that outcome using the UTM values as the connecting thread. Without that link, a scan is just a curiosity metric.
Dynamic vs static QR codes: the trade-off print marketers actually face
Choosing between dynamic and static isn’t a matter of preference. It’s a trade-off between measurement and independence, and it’s worth making deliberately rather than defaulting to whichever generator loads first.
-
Dynamic codes win on flexibility and data. The destination URL can be edited after printing, useful when a landing page moves or a campaign extends. Every scan is logged, which enables A/B testing between placements and lets you build retargeting audiences from people who’ve already engaged with your printed materials, a tactic ConnectQR’s marketing guidance highlights as one of print’s underused advantages over static signage.
-
Static codes win on permanence and independence. Because the destination is baked directly into the code, there’s no vendor to rely on and nothing that can technically “go down”. That makes static the sensible choice for safety information, product recall instructions, or anything printed on packaging with a multi-year shelf life where you’d rather not depend on any third party staying operational.
-
Reprinting is the hidden cost of switching later. A static code converted to dynamic isn’t really a conversion, it’s a brand-new code with a brand-new pattern, which means new printed assets wherever the old one appears. Decide dynamic versus static before the print run, not after you’ve already shipped ten thousand units.
Most marketing use cases, anything you want to measure or update, call for dynamic. Reserve static for the narrow set of cases where permanence matters more than data.
Step-by-step: setting up print QR analytics that actually works
Pro Tip: Print one proof sheet and physically scan every code with three different phones before the full run goes to press. A code that scans fine on-screen can still fail on matte paper or under warehouse lighting.
-
Build a pre-print checklist. List every physical placement, poster, flyer, shelf-talker, vehicle wrap, and assign each one its own unique dynamic QR code. Never reuse one code across multiple placements; you lose the ability to tell them apart later.
-
Standardise your UTM naming convention. Decide on a format before you generate a single code, for example
utm_source=poster_highst,utm_medium=print,utm_campaign=spring26, and write it down in a shared campaign sheet. Consistent naming is what makes cross-placement comparison possible months later. -
Generate the dynamic codes and confirm the redirect logs a scan. Create the code against a destination URL that already carries its UTM string, then scan it yourself and check the vendor dashboard shows the hit within a few minutes.
-
Integrate with GA4 or your vendor’s dashboard. Analytics Mania’s setup guide walks through mapping redirect traffic into GA4 as sessions, provided the UTM values propagate correctly through the redirect chain, so verify that GA4 is actually receiving
sourceandmediumvalues, not just raw pageviews with no campaign attribution attached. -
Test with real scans before the print run ships. Print a small proof batch, scan from different networks (WiFi and mobile data), and confirm the numbers appear where you expect them, in the dashboard, in GA4, or both.
-
Set up regular exports and anomaly alerts. Schedule a weekly or monthly CSV export, or pull data via API if you’re feeding a BI tool, and set a rough threshold so an unexplained spike gets flagged rather than quietly accepted as a win.
Do this before the print order goes out, not after the first reprint reveals a naming inconsistency nobody caught.
Best practices and the mistakes that quietly wreck your data
One code per placement, no exceptions. It’s tempting to save time by reusing a single QR code across several similar posters. Doing so collapses your attribution entirely, you’ll know total scans happened, but never which billboard, shelf, or flyer actually drove them.
Pro Tip: Keep a single shared campaign sheet listing every placement, its unique code, UTM string, and print date. It takes ten minutes to set up and saves hours of guesswork three months later when someone asks which poster performed best.
Beyond that core rule, the recurring errors worth watching for:
- Forgetting UTMs before the print deadline. Once the code is printed, the destination is fixed for every scan that ever happens against it, adding UTMs afterwards tags nothing retroactively.
- Treating link previews as real scans. Messaging apps and some phones auto-preview a link the moment a photo of a QR code is shared, inflating totals with hits that never came from a genuine human scan.
- Ignoring the exposure period. A code live for six months will always beat a two-week flyer on raw totals; normalise by days in market before declaring a winner.
- Never exporting the data. Dashboards are useful for a glance, but joining scan logs to CRM or revenue data requires pulling the raw export, whether CSV or API access, on a regular schedule.
None of this is complicated. It just requires deciding on the process before the print run, rather than trying to reconstruct it afterwards.
How Qrlytics approaches reliable print QR analytics
A professional QR platform should give marketers a small, non-negotiable set of things: dynamic redirects, a real-time dashboard, exportable scan data, and tracking that respects privacy regulation rather than working around it.
Qrlytics is built around exactly that list. Codes created during an active subscription are guaranteed to keep working permanently, even if billing later lapses, which matters enormously for anyone who’s had a printed campaign go dark because a QR vendor deactivated codes over a missed payment. Beyond permanence, the platform offers:
- Dynamic URL updates, so a destination can change without reprinting a single poster
- Real-time scan dashboards with global heat maps for visualising where physical distribution is actually landing
- GDPR-compliant tracking, relevant for any campaign running across markets with strict data rules
- CSV and API export, for joining scan logs to CRM or BI systems the way QRlytics’ own metrics guide describes
For a marketer running a six-month retail campaign or a multi-city poster rollout, that combination removes the single biggest operational risk in print: discovering, halfway through a print run, that your codes have stopped working through no fault of your own.
Why treating print as measurable changes how marketers behave
Most marketers still file print under “brand awareness” and quietly accept that they’ll never know what it actually did. That’s a habit, not a law of physics. Once a printed piece carries a dynamic code with disciplined UTMs behind it, print behaves exactly like any digital channel: it produces numbers you can argue with, defend, or act on.
The operational payoff is bigger than the reporting itself. Fewer wasted reprints, because you catch a broken placement within days rather than at the end of a quarter. Faster iteration, because a poster that underperforms in week one can have its destination swapped rather than being left to run its course. And a genuinely different conversation with finance, one built on placement-level numbers rather than a shrug and a guess about “brand lift.”
None of this requires abandoning static codes entirely, permanent, no-vendor-dependency signage still has its place. It just means being deliberate about which printed pieces need to earn their keep as measured channels, and building the UTM discipline in before the print order goes out, not after.
— The
Get your print campaigns measurable with Qrlytics
Everything covered above, dynamic redirects, UTM discipline, GA4 mapping, CSV exports, is exactly what Qrlytics’ dynamic QR code generator is built to handle, with one difference most QR platforms won’t commit to in writing: codes created during an active subscription keep working permanently, even after cancellation. No printed poster goes dark because a card expired.
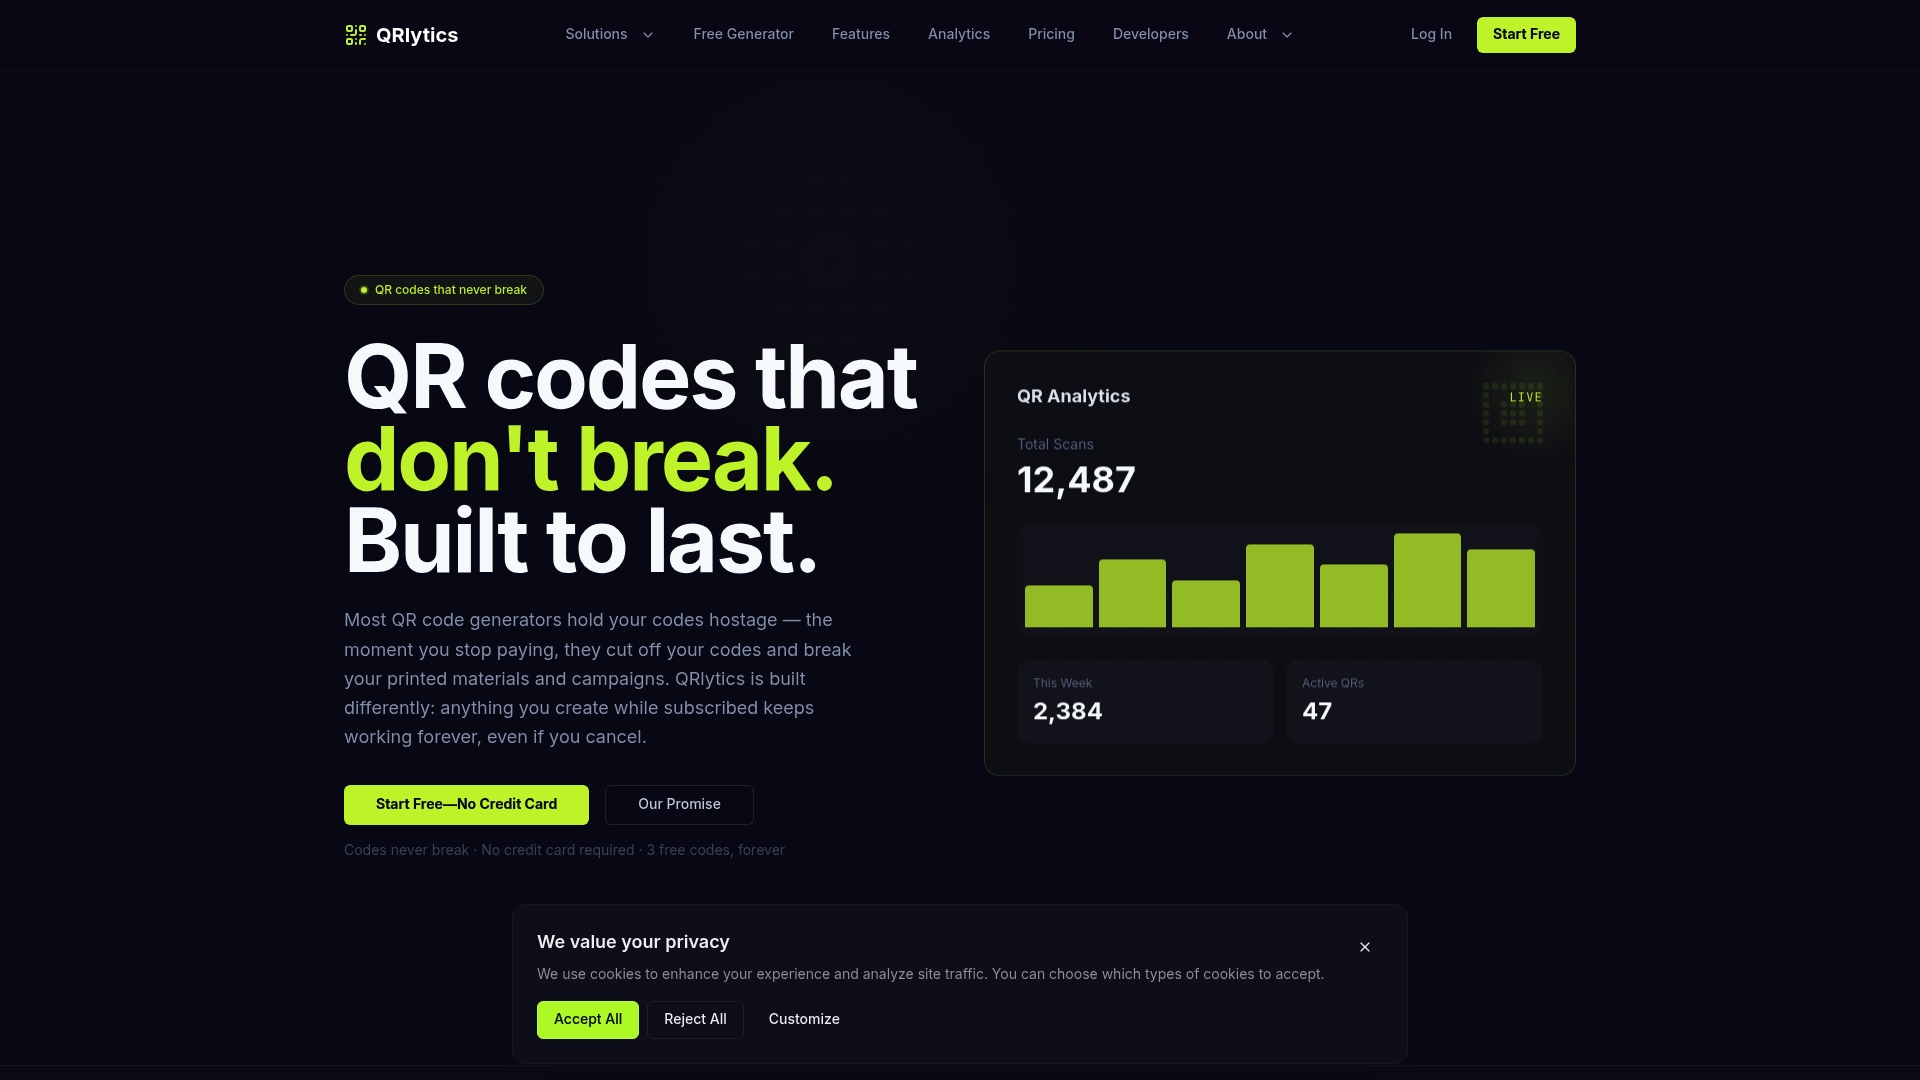
You can create a test code and see the scan dashboard populate in real time on the free tier, no credit card required. If your campaign needs unlimited codes, advanced analytics, or API access for feeding a BI system, the Pro plan covers that, with full pricing listed on the site. Either way, the sensible next step is the same: generate one dynamic code, apply your UTMs, and scan it yourself before the print order goes anywhere near a press.
Sources
For deeper detail on setup and interpretation, Analytics Mania’s GA4 tracking guide walks through UTM propagation step by step. Bitly’s trends report, drawn from 1.9 million codes, and QRStuff’s State of QR Codes Report, built on sixteen years of platform data, both offer first-party evidence on adoption patterns and the UTM measurement gap this article addresses throughout.
FAQ
How do I track analytics from a QR code?
Use a dynamic QR code that points to a redirect rather than a static code that points straight at the destination. The redirect logs each scan’s timestamp, location, and device before forwarding the visitor, and adding UTM parameters to the destination URL before printing lets you map that data into GA4 or a vendor dashboard.
What is the FBI warning about QR codes?
The FBI has warned that criminals sometimes place fraudulent QR code stickers over legitimate ones, redirecting scanners to malicious sites designed to steal login details or payment information. It’s a physical tampering risk rather than a flaw in QR technology itself, and it’s a strong argument for using a reputable, monitored dynamic code provider rather than a disposable one-off generator.
Can a QR code be printed?
Yes, QR codes print reliably on posters, packaging, flyers, and signage, provided the code has enough contrast and sufficient size relative to the expected scanning distance. A static code stays fixed forever once printed, while a dynamic code lets you edit the destination and keep tracking scans without reprinting anything.
How can I extract data from a QR code?
If the code is dynamic, extract scan data through your vendor’s dashboard export or API, most platforms support CSV export for joining scan logs with CRM or BI tools. A static code holds no scan history anywhere, since nothing ever logs the interaction; the only data you can pull is whatever text or URL is encoded in the pattern itself.
How do I choose between dynamic and static QR codes for print?
Choose dynamic whenever you need scan data, A/B testing, or the ability to edit the destination after printing, which covers most marketing use cases. Choose static only for cases where permanence and zero vendor dependency matter more than measurement, such as safety instructions on long-shelf-life packaging.