Unique vs Repeat Scans: Marketers, Fix QR Reports With UTMs and GA4

A unique scan counts a distinct device once within your reporting window, while total scans counts every single scan event, including repeats from the same phone. Divide total scans by unique scans and you get scans per scanner, the simplest number for understanding how often people come back to the same code.
TL;DR:
- Use unique scans as the denominator for reach or per person conversion rates, and total scans to measure repeat activity or overall volume.
- Ask how the platform identifies devices and which deduplication window it applies; session, daily, and campaign windows produce results that cannot be compared directly.
- Multiple devices can inflate unique counts, while shared devices can suppress them; cookies, private browsing, VPNs, and bots also distort both metrics.
- Tag destinations with UTM parameters, use dynamic redirects that log scans on the server, and reconcile dashboard exports against GA4 before a large print run.
Table of Contents
- Unique vs total scans: which answers reach, which answers usage
- How platforms count a ‘unique’ scan: cookies, fingerprints, IPs and time windows
- Why ‘unique’ counts can be misleading: real-world causes of mismatch
- Which metric to report: simple rules for campaign reporting
- Practical measurement checklist: UTM, GA4 and reconciliation steps
- Practical expectations from an experienced QR analytics practitioner
- A platform built for codes and tracking that keep working
- FAQ
Unique vs total scans: which answers reach, which answers usage
Unique scans answer “how many people found this code”. Total scans answer “how much activity did this code generate”. They are different questions, and mixing them up leads to the wrong conclusions in a campaign report.
Picture a poster campaign that logs total scans and unique scans over a reporting period. That gap tells you something useful: a chunk of your audience scanned more than once, perhaps to check opening hours or re-read a menu.
- Scans per scanner = total scans ÷ unique scans, which gives the average scans per unique device.
- A ratio close to 1 suggests mostly first-time, one-off interactions.
- A higher ratio suggests a code that people return to, such as a loyalty card or a menu.
For board-level reporting, lead with unique scans when the question is reach, and bring in total scans when the question is engagement depth. Reporting only one of the two numbers hides half the story.
How platforms count a ‘unique’ scan: cookies, fingerprints, IPs and time windows
No scan tracking system can see an actual person standing in front of a poster. What it sees is a device making an HTTP request, so “unique” is always an estimate built from available signals rather than a verified headcount.
- First-party cookies or local storage flags set on the landing page, which persist until cleared.
- Browser fingerprinting signals such as user agent string, screen size and device type.
- IP address combined with a session window, useful when cookies are unavailable.
- Session continuity maintained server-side between the scan and the redirect.
Dynamic QR codes make this more reliable because the code points to a redirect service rather than a fixed URL, so the platform can log the scan event server-side before sending the device onward. Static codes, by contrast, often point straight to the destination with no intermediary logging at all.
The deduplication window you choose changes the numbers substantially. A platform that treats repeat scans within the same session as one unique scan will report differently from one that uses a rolling daily window or a full campaign-length window. None of these is wrong, but they are not interchangeable, so the window matters as much as the method.
Browsers that block third-party cookies, and privacy settings that limit fingerprinting, mean every deduplication method has gaps. That is expected, not a sign of broken tracking.
Pro Tip: Ask any QR platform you evaluate which deduplication window it uses by default, and whether you can change it for a specific campaign.
Why ‘unique’ counts can be misleading: real-world causes of mismatch
Unique scan counts are estimates, and several everyday behaviours push that estimate away from the true number of people involved.
- One person scanning from a phone, then again from a tablet, inflates uniques for a single human.
- A shared device, such as a reception desk tablet or a device behind a company’s shared network address, can merge several people into one unique count.
- Private browsing, cookie clearing, or a factory reset can fragment one returning person into several separate uniques.
- Caching, proxy servers, VPNs and automated bot scans can distort both totals and uniques in ways that are hard to separate out afterwards.
One rule holds regardless of method: unique scans can never exceed total scans for the same code and the same time window, because every unique scan is also counted as a total scan. If your dashboard ever shows the reverse, something in the reporting pipeline is broken rather than the maths.
Which metric to report: simple rules for campaign reporting
Pick the metric that matches the question you are actually trying to answer, rather than defaulting to whichever number looks better.
- If your goal is reach, or you need a denominator for a per-person conversion rate, use unique scans.
- If your goal is understanding engagement frequency, server load, or how often the same audience returns, use total scans.
- When a stakeholder needs both, report them side by side with a one-line label stating the deduplication window used.
Using a clear label matters more than it sounds. A label that states the unique scan count and deduplication window prevents confusion later when someone compares this campaign to one that used a different window.
Practical measurement checklist: UTM, GA4 and reconciliation steps
Scan counts on their own cannot tell you whether a scan turned into a sale, a sign-up or a booking. Closing that gap takes a few consistent habits.
- Append UTM parameters to every QR destination URL, so sessions and downstream conversions can be attributed correctly once the visitor lands on your site. Our guide on adding UTM parameters to QR codes walks through the setup.
- Favour dynamic QR codes with server-side redirect logs, which preserve session continuity between the scan event and the landing page visit.
- Document a fixed deduplication time window for each campaign report and keep it consistent across comparisons.
- Filter out bot traffic and set a minimum engagement threshold, such as time on page or a specific event, before counting a conversion.
- Export your QR dashboard’s CSV and reconcile it against GA4 events to confirm the two sources agree within a reasonable margin.
Combining a QR dashboard for raw reach with GA4 for behavioural attribution is the standard approach for tracking a campaign end-to-end, since neither tool alone covers the full journey from scan to outcome. Our QR analytics metrics guide covers the export and reconciliation step in more depth, and this thank you page tracking guide is a useful reference for confirming that a scan genuinely ended in a conversion rather than a bounce.
Pro Tip: Run your reconciliation check on a small test batch of codes before you commit to printing thousands of units with the same tracking setup.
Practical expectations from an experienced QR analytics practitioner
Modest differences in unique scan counts between platforms can occur. What matters more is documenting your chosen deduplication rules from the start, so shifts in the numbers are explainable rather than alarming.
Before a large print run, run a verification test comparing UTM-tagged GA4 data against the native QR dashboard numbers. Keep every report transparent about the deduplication window and attribution method used, because that single habit prevents more confusion than any dashboard feature ever will.

A platform built for codes and tracking that keep working
Several of the mismatches above (cookie blocking, broken redirects, codes that quietly stop working after a billing hiccup) get worse when the underlying QR code isn’t reliable in the first place. A dynamic QR code with persistent redirection and built-in analytics removes one layer of guesswork, because the scan event is logged server-side before the redirect happens at all.
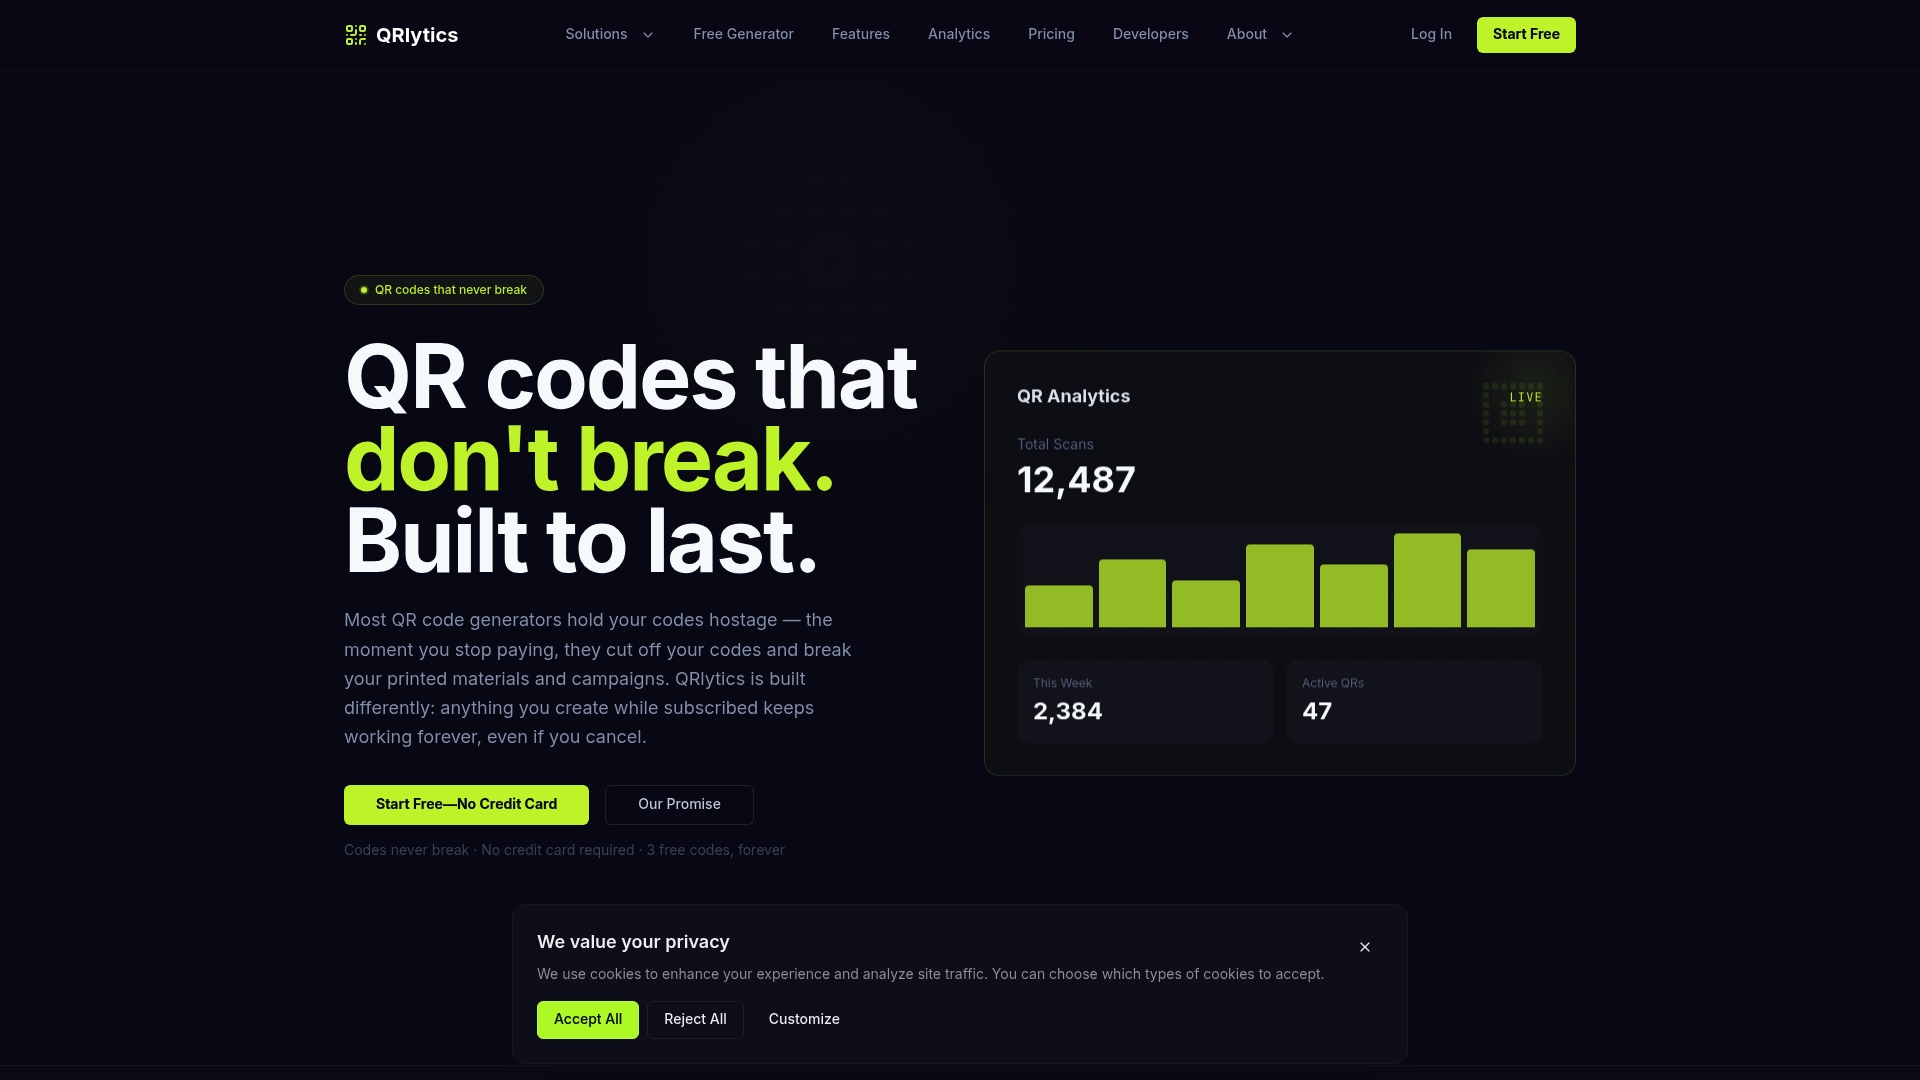
We built QRlytics around that guarantee: every code created during an active subscription keeps working permanently, even if billing lapses later. Alongside that, we give you real-time scan analytics, GDPR-compliant tracking and dynamic codes you can redirect at any time without reprinting.
- Create and test a dynamic QR code that stays editable after printing.
- Check live reach and usage numbers with QR codes that include built-in analytics.
- Start on the Free plan at $0 per year, with no credit card required, and compare the numbers against your own GA4 setup before scaling up.
FAQ
What is the difference between unique and repeat scans?
A unique scan counts a distinct device once within a set reporting window, while a repeat scan is any additional scan from that same device within the same window. Total scans include both the first scan and every repeat, so total scans is always equal to or greater than unique scans.
How do you calculate scans per scanner?
Scans per scanner is total scans divided by unique scans for the same code and time period. A ratio close to 1 suggests mostly first-time, one-off interactions, while a higher ratio points to an audience returning to the same code repeatedly.
Why might unique scan counts look too high or too low?
Counts run high when one person scans from multiple devices, and run low when several people share one device or network address. Private browsing, cookie clearing and VPN use can also distort the figure in either direction.
Should I use unique or total scans for a conversion rate?
Use unique scans as your denominator when the conversion rate should reflect per-person behaviour, since that avoids counting the same visitor’s repeat scans as separate opportunities. Use total scans only when you specifically want to measure overall activity or engagement volume rather than reach.
How can I link QR scans to actual website conversions?
Append UTM parameters to your QR destination URL so Google Analytics 4 can attribute the resulting session and any conversion event back to that specific code. Pairing a QR dashboard’s reach data with GA4’s behavioural tracking is the standard way to follow a scan through to an outcome.